19 minutes
Activity Tracking Overview in Hubstaff
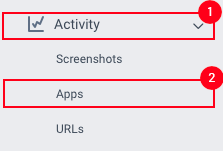
Activity tracking recorded by the app can be viewed by your team by navigating to the Activity page located on your sidebar.
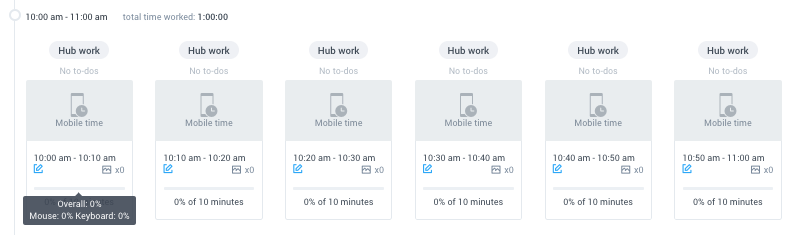
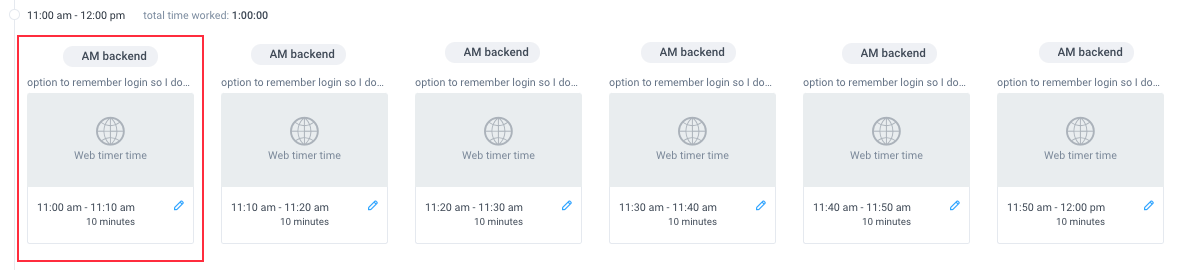
The mobile apps and web timer cannot record keyboard/mouse activity and time tracked to these apps are not included in activity calculations.
Manual time, break times, and projects excluded from activity tracking are not included in activity calculations.
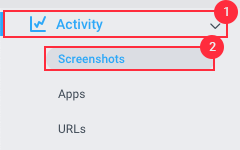
The Activity page is broken down into 3 sections:
Screenshots
Hubstaff Insights
Opening the Screenshots page, you will see the Hubstaff Insights bar, which shows the following information:
- Total time worked for the day, and the average activity.
- Focus time percentage, which refers to the duration during which a team member dedicates uninterrupted attention to a single project or task for a minimum of 30 minutes.
- Meetings, which will be the time the member spent in meetings.
- Work time classification, which is the percentage of core productive apps and URLs over total time spent.

Below the Insights bar, you will see screenshot recordings divided every hour, then broken down into 10-minute blocks of time.
Activity Benchmarks
You’ll also see the Activity benchmarks button, which will explain activity levels and what to expect from your team based on activity trac, as well as benchmarks compared to other organizations. Click here to learn more.
![]()

Viewing Screenshots
You can filter the screenshots taken by:
- There are 2 options to view the screenshots. Every 10 min (breakdown by 10-minute intervals) and All screenshots.

- Selecting the date on the Calendar, toggling the left and right buttons to move between dates, clicking Today to show the current day’s screenshots, and All Notes to filter screenshots where notes were added by your team members. Dates with activity will be highlighted in blue, future dates are grayed out, and days without activity are displayed in black.

- Timezone – select either the organization’s timezone (Default), member’s timezone, or the viewer account’s timezone.

- Member – You have the option to filter by ‘Tracked Time’ or ‘No Time Tracked’ in the member filter. Once selected, you can further narrow it down by choosing a specific team member from the dropdown menu.

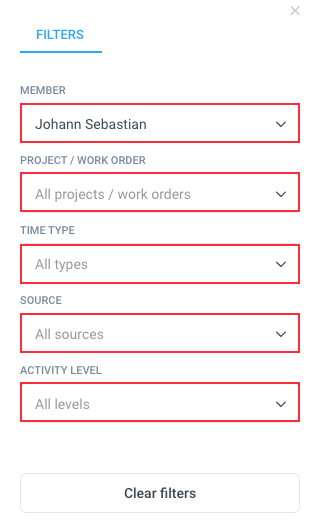
- Filters – Filter by Member to filter screenshot activity by team member, by Project to filter screenshots recorded on a specific project, by Time type to filter screenshots by type (Idle/Resumed/etc.), by Source to filter screenshots by the app used to track time, and finally, by Activity level to filter screenshots by activity percentage. You can filter activity levels in increments of 10% as well as 95% to have more granularity on higher activity level averages.
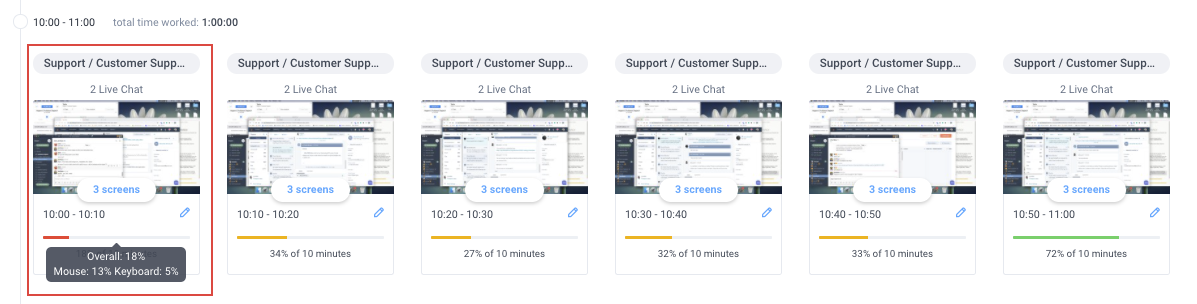
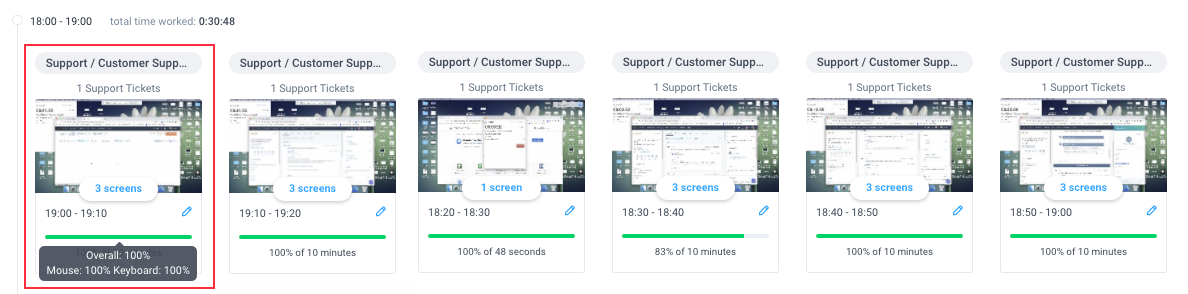
On the thumbnail gallery, you can hover on the Activity Bar shown in Green on a 10-minute block of time to view the Activity Level, and the breakdown of keyboard and mouse activity. In this case, the user was active 80% of the ten-minute block between 9:00 am-9:10 am with a 7% keyboard and 74% mouse activity.

Activity levels from 20% to 50% will be color-coded as Yellow (caution status).

Activity levels from 0% to 20% will be color-coded as Red (warning status).
Below are a few articles you might find helpful about screenshots:
- For more details about the thumbnail gallery, click here.
- For instructions on how to delete screenshots, click here.
- No screenshots/Screenshots not yet uploaded, click here.
- For information about how to change screenshot frequency, click here.
- To know more about who can access screenshots on your organization, click here.
- For more information about how activity levels are calculated, click here.
Apps
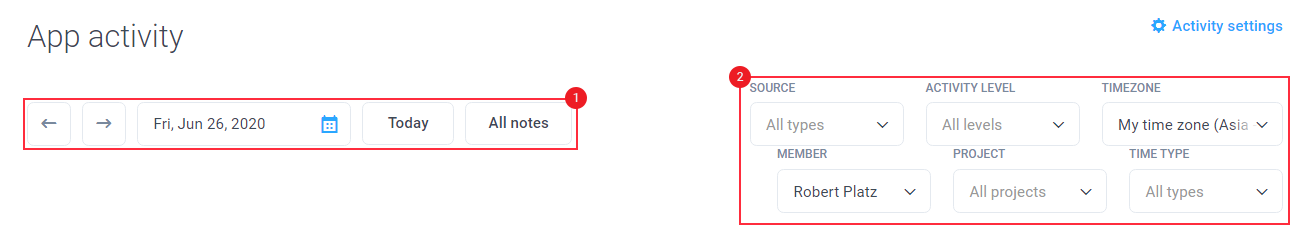
Opening the Apps page will show all the applications used by your team.
You can filter Apps by:
- Selecting the date on the Calendar, toggling the left and right buttons to move between dates, clicking Today to show the current day’s apps, and All Notes to show notes that were added by your team members while using an app. Dates with activity will be highlighted in blue, future dates are grayed out, and days without activity are displayed in black.
- Filter by Project to filter apps recorded while tracking time on a specific project, by Timezone to toggle between apps taken on the organization’s timezone or the user’s timezone, and finally, by Member to filter app activity by member.
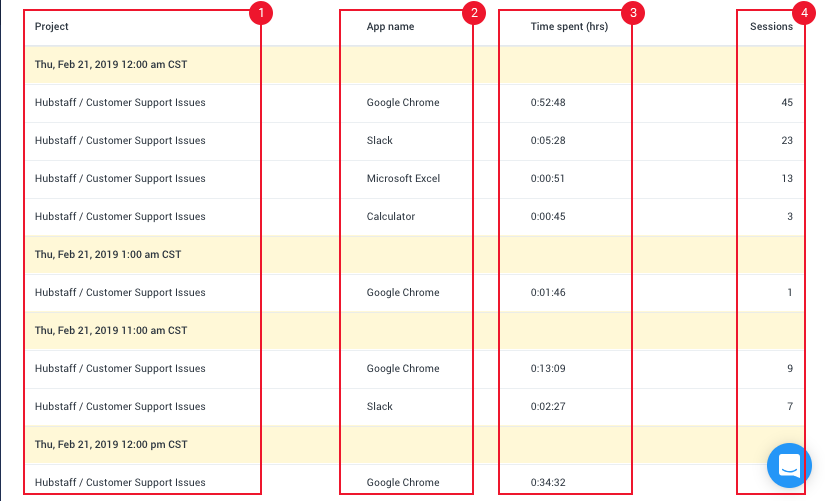
Below the filters, you will see the following data:
- The project being tracked while using the application
- Application open
- Time Spent on an application
- Sessions
On the first line below, it shows the user tracking time on the Hubstaff / Customer Support Issues project while using Google Chrome for 52 minutes and 48 seconds, 45 times between 12:00 am CST to 12:59 am CST.
Below are a few articles you might find helpful about App tracking:
- For more information on how to generate App and URL Reports, click here.
- For details on how to enable App and URL tracking, click here.
URLs

The URLs page will show all the websites visited by your team.
You can also filter URLs:
- Choose a date range on the calendar. Dates with activity will be highlighted in blue, future dates are grayed out, and days without activity are displayed in black.
- Filter by Project to filter URLs recorded while tracking time on a specific project, by Timezone to toggle between URLs recorded on the organization’s timezone or the user’s timezone, and finally, by Member to filter URL activity by a member.

Below the filters, you will see the following data:
- Project recording time while active on a website.
- Website.
- Time spent on a website.
On the first line below, it shows the user tracking time on the Hubstaff / Customer Support Issues project while visiting “app.intercom.io” for 39 minutes and 22 seconds, between 12:00am CST to 12:59am CST.
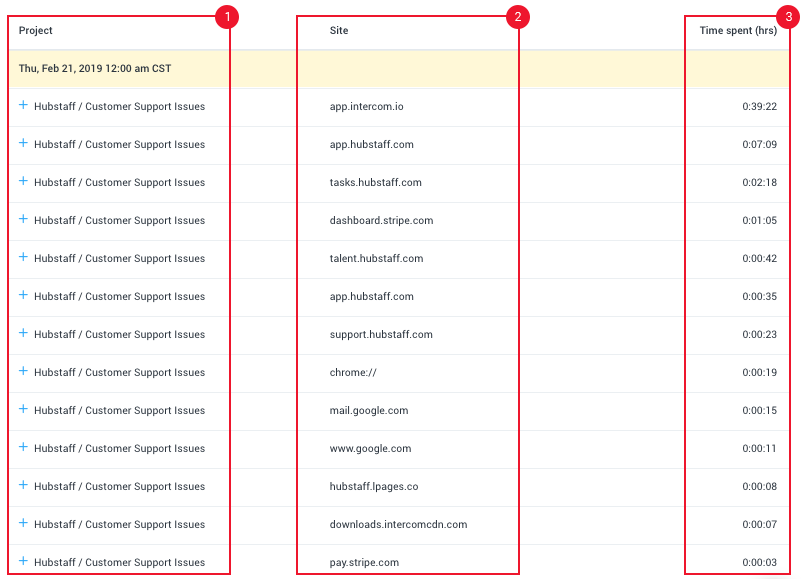
You can also click the “+” button next to a line item as shown below to expand the websites visited during that timeframe:
Below are a few articles you might find helpful about App and activity tracking:
- For more information on how to generate App and URL Reports, click here.
- For details on how to enable App and URL tracking, click here.