13 minutes
How are activity levels calculated in Hubstaff?
Activity levels in Hubstaff are calculated based on the percentage of keyboard and mouse strokes over the total time tracked for a specific time period. The activity levels feature lets you know exactly how productive you or your team are when tracking time. You may use this data to quickly address team efficiency on the spot.
Manual time, work breaks, and projects that have the Record activity setting disabled are not included in activity calculations.
Calculating Activity Levels
Below is how Hubstaff calculates activity levels:
- For every second, we label the user as active or inactive. A mouse movement or keyboard stroke = active. No keyboard or mouse = inactive.
- We add all of these numbers up and give a total % of activity for that 10-minute segment using this equation: Active seconds / 600 = activity rate %
- Also, we track if the user was active or not. By default, 20 minutes without inactivity triggers an inactive status, in which case the desktop client gives the member either the option of removing that time from their log because they were inactive, or automatically discards the idle time depending on the organization setting.
Activity rate (activity %) represents the percentage of seconds that the mouse or keyboard was interacted with on a specific time frame.
Examples:
- If you used the keyboard continuously for 30 seconds and then watched a training video for 9 minutes and 30 seconds, the activity percentage would be 5%. This is because you only directly interacted with the computer for 5% of the total 10-minute period.
- Another example would be if you were reading different articles online, the only ‘active’ time reported would be the few seconds it takes you to get to the next article, or to scroll down the page as you read. So if you read 4 different pages for a total of 10 minutes, it’s very likely that you only “interacted” for 20 or 30 seconds total.
Here’s an easy way to think about how we calculate activity rates:
If you have 100 seconds of tracked time, and 20 seconds of idle time (no mouse or keyboard movement), you’d have an 80% activity rate.
Those 100 seconds might look like this:
| Mouse | Keyboard | No Activity | Total Activity | |
| 20 seconds | Yes | 20 | ||
| 35 seconds | Yes | Yes | 35 | |
| 15 seconds | Yes | 15 | ||
| 20 seconds | Yes | 0 | ||
| 10 seconds | Yes | 10 | ||
| 80 seconds or 80% activity out of 100 seconds |
80% overall activity rate
Because 80% of the 100 seconds were spent using the mouse or keyboard.
What activity rates mean
Depending on someone’s job and daily tasks, activity rates will vary widely.
Jobs involving data entry, design, development, and other high mouse and keyboard activity will tend to have higher averages. Team members who spend more time in meetings, doing more research, or participating in video chats will tend to have lower scores. It makes sense; they’ll be moving their mouse and keyboard less if they’re primarily talking or reading.
That’s why people with 75% scores and those with 25% scores can often times both be working productively. If a usual day for your team involves checking email, reading articles, or having calls with one another, they might have an average activity rate of around 50%.
Instead of using activity rates as a one-time snapshot of productivity and making a decision based only on them, our recommendation is to use these as trends.
Look for patterns, and if a continually declining activity rate shows up, have conversations. The idea of activity rates is to keep a dialogue going and improve processes and workflow over time.
At Hubstaff, we discourage the use of quotas or scoring based on activity rates. Frustration can emerge when managers and team members aren’t clear on what’s expected of them, so an open dialogue can keep work moving.
Common causes of low activity
These are a few possible reasons why you are seeing low activity levels and percentages:
- Low actual keyboard/mouse activity – this is the most common cause of low activity. It occurs when a user sparsely uses their keyboard or mouse within 10 minutes. This can be expected with tasks such as meetings.
- Hardware issues with peripherals – in this scenario, the usual suspects are the user’s keyboard/mouse malfunctioning. Common issues we’ve found are stuck keys on the keyboard (causing small input during idle time) and defective or intermittent issues with the computer mouse.
- Workers being hit with inactivity/idle time warnings and then “keeping” the time – Details here. Time tracked as idle will cause the activity percent to drop, as no activity is recorded (hence why we detected Idle).
- Small blocks of time recorded – for instance, if the person logs in at 12:59 PM and works for 30 seconds, they may not be very active at this time. However, as our server communicates every 10 minutes, this time will still be uploaded. Therefore, these 30 seconds while having low activity may not be very indicative of overall performance.
The easiest way to keep tabs on your team’s productivity and efficiency is by getting the Insights. See why activity drops—unlock trends, comparisons, and performance insights with the Insights add-on.
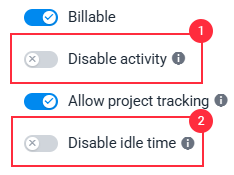
When attending a huddle or sessions that will require minimal activity, we advise adding a project called “Meetings”, and while doing so, you can “Disable Activity” and/or “Disable Idle Time” to prevent a drop in activity levels.
Activity benchmarks
Our activity benchmarks feature helps you understand all about activity levels. It also answers common questions about activity levels such as: What type of applications record activity? What activity is good or bad? How do your organization’s activity levels compare to other organizations in the same industry?
First, navigate to the Activity > Screenshots page.

Then click on the Activity benchmarks button.
![]()
The basics
The basics section shows you a table of four activity level tiers that explain what levels of activity to expect from your employees. It also explains how Idle time affects activities and how you can change the settings. You can also watch the video about how activity tracking works in Hubstaff by navigating to the “Welcome to activity video” section of the page.

How it works
This section explains how activity levels are calculated, and what factors have an impact on the overall activity averages/percentages.

Activity in your organization
This section shows you the average activity percentage for your entire Hubstaff organization.

Some noise-cancelling headphones may result in higher or simulated recorded activity levels. This can happen because certain devices prevent the computer from entering an idle state while they are in use. Behavior may vary depending on the hardware and operating system.