77 minutes
Hubstaff Reports Overview
Screenshots and activity levels only show part of the picture. Our reports provide deeper insight into what your team is working on, how they spend their time, and how efficiently they work.
Data is organized into easy-to-use, customizable reports that let you track total work time, time spent on projects or job sites, and even idle time for each user.
![]()
Our powerful reporting section provides multiple options for creating reports and viewing information within your organization. Navigate to the Reports section on the sidebar to begin.
Report Categories
Scheduled reports are only available on Grow plans and up.
If you are configured as an organization owner/manager, you will be able to see two tabs on each report:
The ME tab will show your personal data (same as users), and the ALL tab will show all data recorded within the organization.
General
Time and activity
With the Time & Activity report, you can get a detailed report for the total time tracked, activity percentages, spent amounts, and billable amounts by any user for a project or task. This report can be accessed by navigating to Reports > General > Time & Activity.

- Me tab – the “Me” tab shows the data you tracked as a user.
- All tab – the “All” tab will display all data you have access to within your organization. If you are a project manager, you’ll be able to view data for all the projects where you are a member. If you are the organization owner, you’ll be able to view all data within the organization.
- Calendar – lets you select the date range for the data you wish to report.
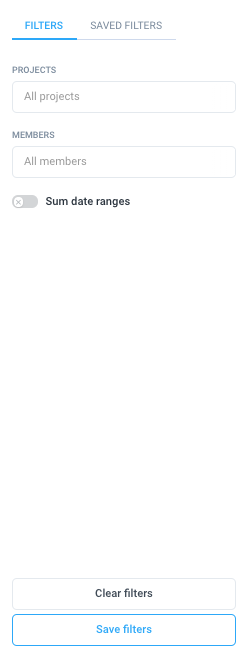
- Filters – clicking on the Filter button will let you choose which filters you’d like to apply. For this report, you can filter the data by clients, projects, members, or to-dos. To view totals, you can toggle the “Sum Date Ranges” setting.
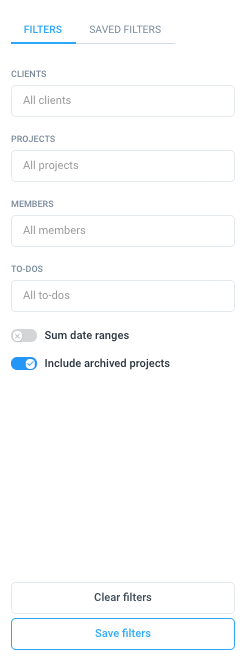
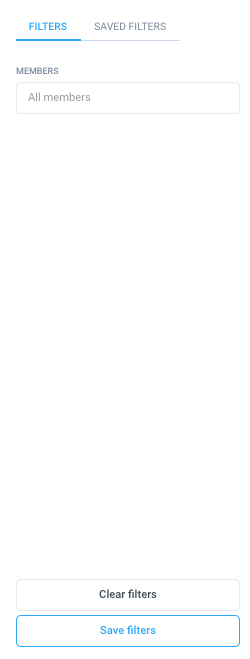
- Saved Filters – lets you save the filters currently applied to the report for future use.
- Total Time – shows the total time tracked based on the date range selected.
- Average Activity – shows the total time tracked based on the date range selected.
- Total Spent – shows the total amount spent based on the date range selected.
- Graphs -show you a daily trend graph based on the selected data range.
- Collapse – collapses the data.
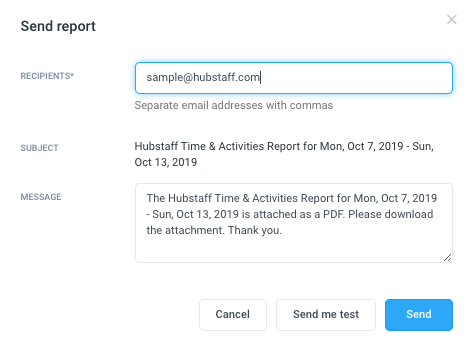
- Send – lets you send the generated report to an email recipient. You can send the reports to multiple recipients by separating email addresses with commas.
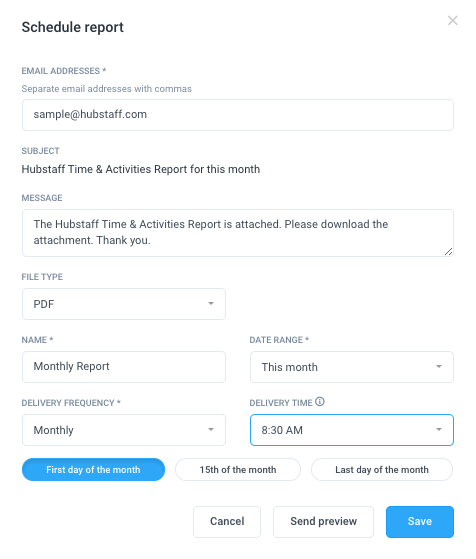
- Schedule – allows you to schedule a report to be sent. You can choose to send the report in CSV or PDF formats, and choose the date range, frequency, and delivery time of the report.
- Export – lets you export the generated report in CSV or PDF format.
- Group by Filter – presents the data grouped based on the selected filter.

- Report columns – allows you to add/remove columns to the report.

- Project – displays the project where the time was tracked.
- Members – displays the names of the member/s who tracked time.
- About – shows information about the user.
- To-do – displays the tasks/to-dos where the time was tracked.
- Regular hours – shows total regular time tracked.
- Overtime – shows total overtime.
- Time off – shows time off holiday hours.
- Total Time – shows the total time tracked to a specific project, task, to-do, or team member.
- Activity – displays the total activity percentage based on the time tracked.
- Spent – shows total spent amounts based on the total time tracked multiplied by the pay rate set.
Daily Totals
The Weekly report displays the daily/weekly total time, activity percentages, and amounts spent for each workweek. This report can be accessed by navigating to Reports > General > Weekly.

- Me/All tabs – the “Me” tab shows data for yourself as a user, and the “All” tab will display all data you have access to within your organization. If you are a project manager, you’ll be able to view data for all the projects where you are a member. If you are the organization owner, you’ll be able to view all data within the organization.
- Calendar – lets you select the date range for the data you wish to report.
- Filters – clicking on the Filter button will let you choose which filters you’d like to apply. For this report, you can filter the data by projects and/or members. You can also click on “Save Filters” to save your current filters.
- Saved Filters – lets you apply saved filters to generate a custom report.
- Projects/Work orders worked – shows you the total number of users who tracked time for the week selected.
- Break time – shows the total break time taken by the user/s.
- Average hours per day – displays the average time tracked per day for the selected week.
- Average activity – displays the average activity for all users who worked during the week.
- Earned – displays the total amounts earned for team member/s for the week based on time totals multiplied by each user’s pay rate.
- Graphs – displays a daily trend graph based on the data range selected.
- Send – allows you to send the report to a specific recipient.
- Schedule – allows you to schedule the report to be sent.
- Export – allows you to download the report via a CSV/PDF file.
- Columns – provides additional column options for the report.
- Project/work order – shows the project/work order name.
- Daily Totals – displays each individual team member’s total time tracked daily.
- Regular hours – shows the regular hours tracked by the team member.
- Overtime – shows the total overtime hours tracked by team member/s.
- Time off – shows the total time off hours used by the team member during the date span selected.
- Total worked – displays each individual team member’s total time tracked for the week.
- Activity – displays each individual team member’s activity percentage for the week.
- Earned total – displays each individual team member’s total earned amounts for the week based on each team member’s bill rate.
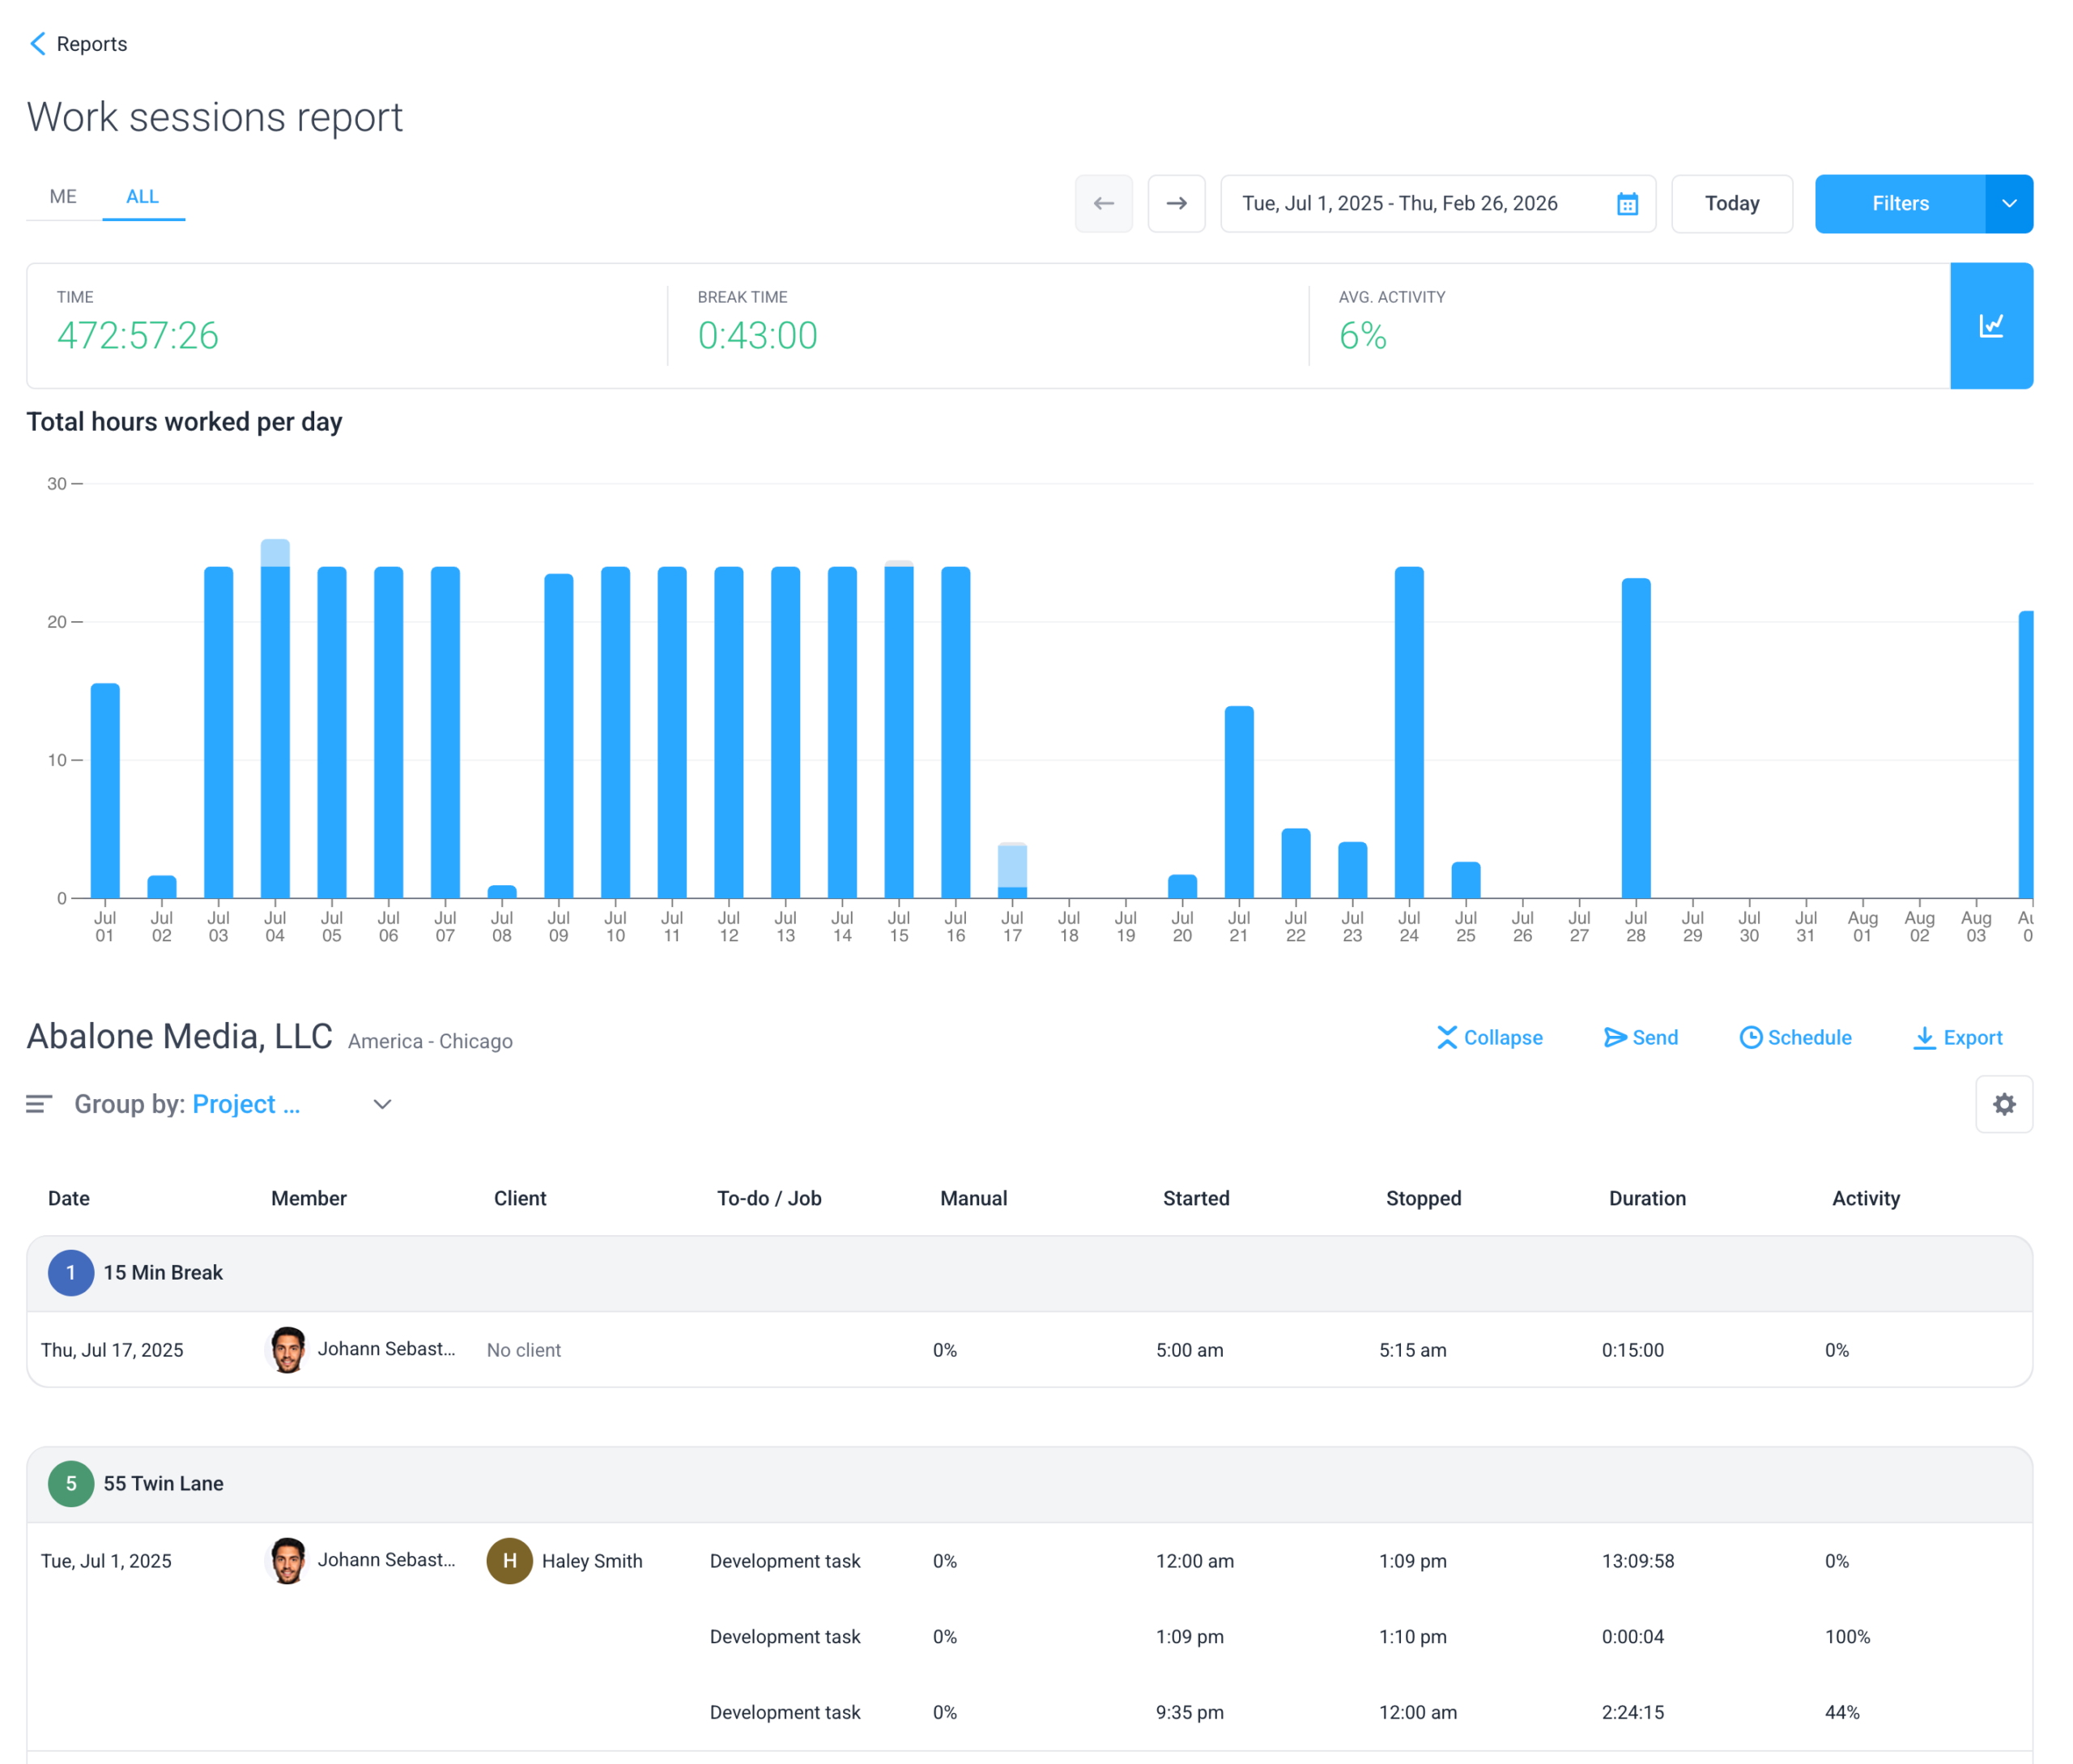
Work sessions
Work session reports allow you to display and/or download timer start and stop data for yourself or your team. The report also contains specific details for each session, including clients, projects, members, to-dos/jobs, the amount of manual time tracked per session, session duration, and activity levels per session.
To generate a work session report:
Step 1
Navigate to Reports > All Reports.

Step 2
Under the General menu, click Work sessions.

Step 3
The work sessions report will appear.
- Me/All tabs – the “Me” tab shows the data you tracked as a user, and the “All” tab will display all data you have access to within your organization. If you are a project manager, you’ll be able to view data for all the projects where you are a member. If you are the organization owner, you’ll be able to view all data within the organization.
- Calendar – lets you select the date range for the data you wish to report.
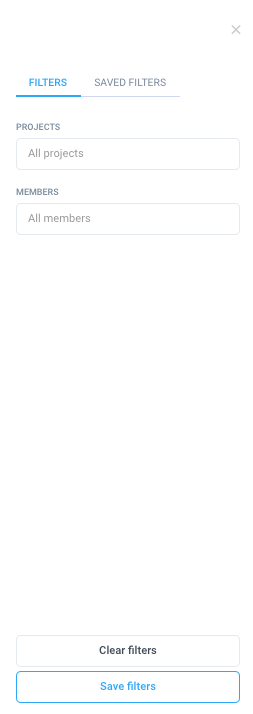
- Filters – clicking on the Filter button lets you select which filters you’d like to apply. For this report, you can filter the data by teams/members, projects/work orders, clients, to-dos/jobs, activity level, time type, and source.
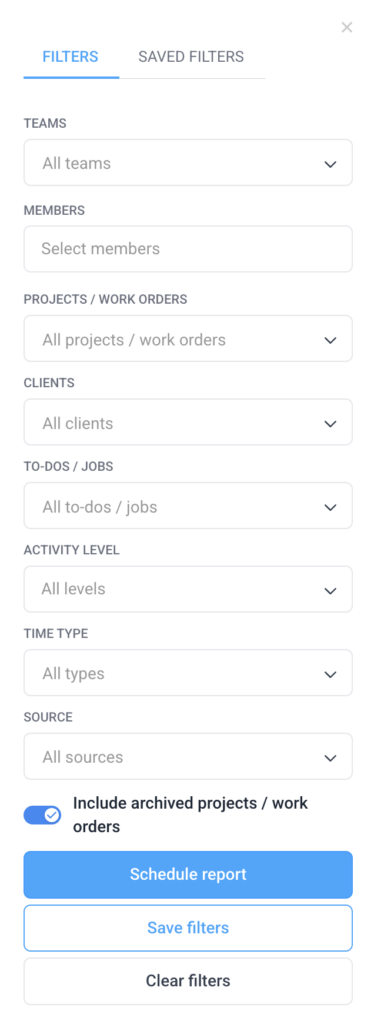
- Saved Filters – lets you save the filters currently applied to the report for future use.
- Time – displays the total time tracked based on the date range selected.
- Break Time – shows how much break time was tracked within the selected period.
- Average Activity – displays the total time tracked based on the date range selected.
- Graphs – show you a daily trend graph based on the selected data range.
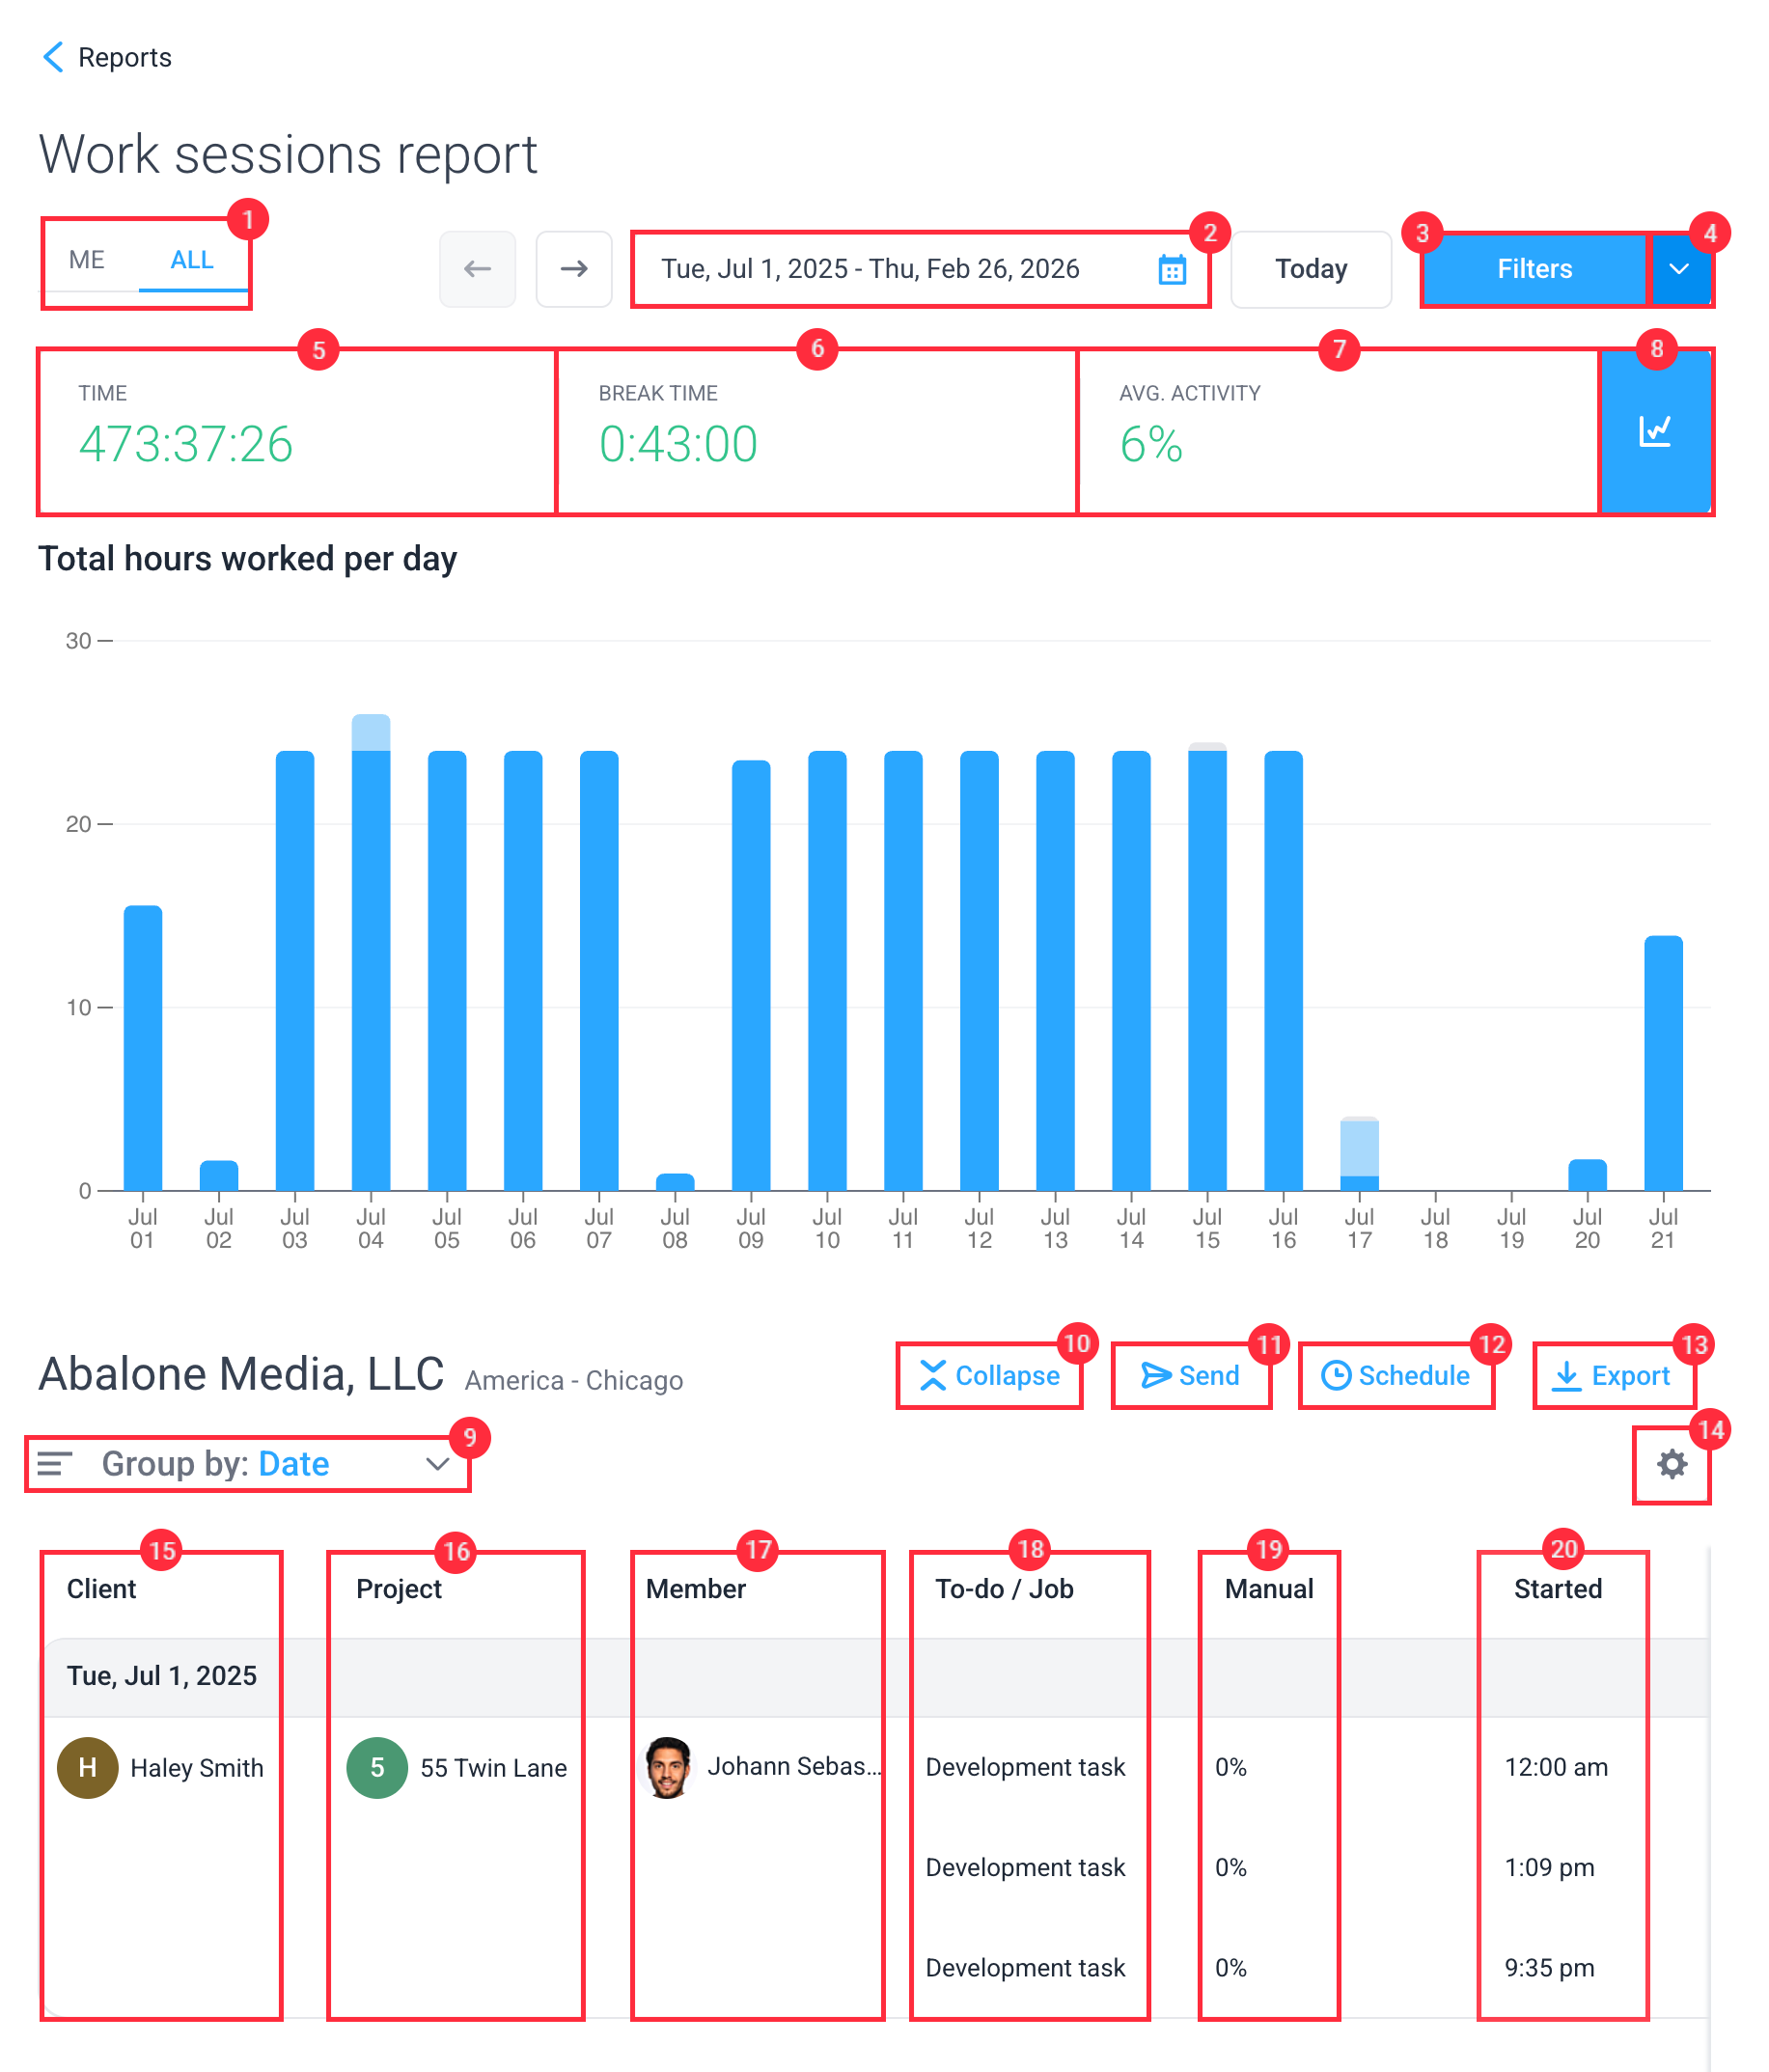
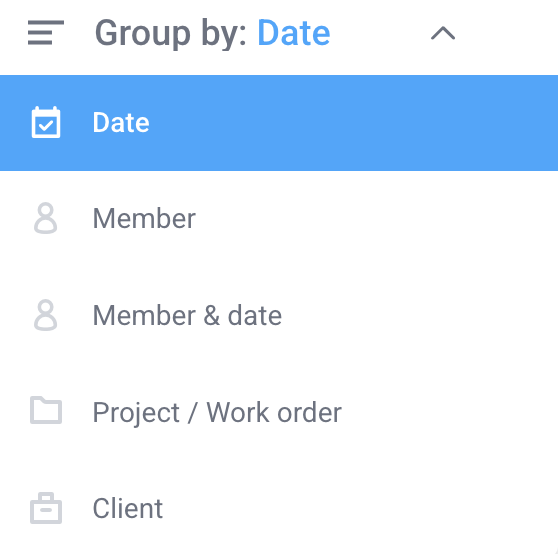
- Group by Filter – presents the data grouped based on the selected filter.
- Date – groups data by the day.
- Member – groups data by team member.
- Member & date – groups data by a combination of the team member and date.
- Project / Work order – groups data by project and/or work order (when available).
- Client – groups data by specific clients.
- Collapse – collapses the report.
- Send – lets you send the generated report to an email recipient. You can send the reports to multiple recipients by separating email addresses with commas.
- Schedule – allows you to schedule a report to be sent at a specific time. You can choose to send the report in CSV or PDF formats, and select the date range, frequency, and delivery time of the report.
- Export – lets you export the generated report in CSV or PDF format.
- Report columns – allows you to add/remove columns to the report.
- Client – displays the client assigned to the project.
- Project – displays the project where the time was tracked.
- Members – displays the names of the member/s who tracked time.
- To-do – displays the tasks/to-dos where time was tracked.
- Manual – shows the total manual time tracked within each session.
- Started – shows the time the timer was started.
- Stop – shows the time the timer is stopped.
- Duration – displays the total duration per session.
- Activity – shows total activity levels recorded within each session.

Apps and URLs
The Apps & URLs report allows you to view how much time was spent by your team on certain applications and/or websites. This report can be accessed by navigating to Reports > General > Apps & URLs report.
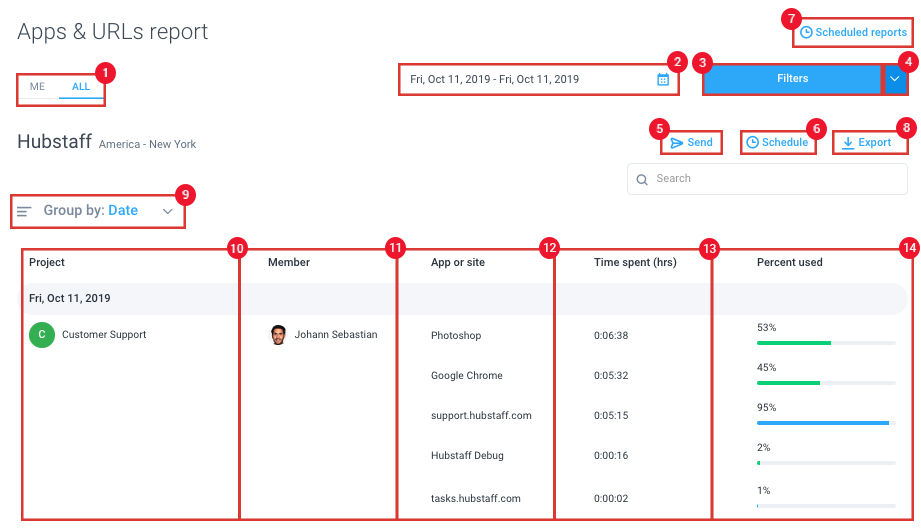
- Me/All tabs – the “Me” tab shows data for yourself as a user, and the “All” tab will display all data you have access to within your organization. If you are a project manager, you’ll be able to view data for all the projects where you are a member. If you are the organization owner, you’ll be able to view all data within the organization.
- Calendar – lets you select the date range for the data you wish to report.
- Filters – clicking on the Filter button will let you choose which filters you’d like to apply. For this report, you can filter the data by item type (Apps, URLs, Apps & URLs), projects, and members. You can also click on “Save Filters” to save your current filters. To view totals, you can toggle the “Sum date ranges” setting.
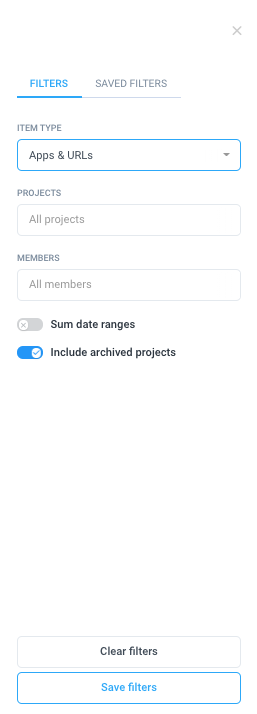
- Saved Filters – lets you apply saved filters to generate a custom report.
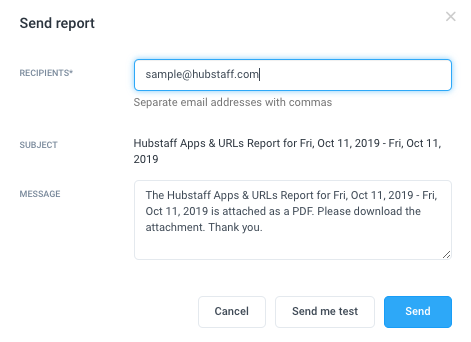
- Send – lets you send the generated report to an email recipient. You can send the reports to multiple recipients by separating email addresses with commas.
- Schedule – allows you to schedule a report to be sent. You can choose to send the report in CSV or PDF formats, and choose the date range, frequency, and delivery time of the report.
- Scheduled reports – opens the “Scheduled Reports” page that displays all scheduled reports for your organization.
- Export – lets you export the generated report in CSV or PDF format.
- Group by Filter – presents the data grouped based on the selected filter.
- Project – displays the project being tracked when the app or site was used/visited.
- Member – displays the member who visited the site/used the application for the time tracked.
- App or Site – displays the specific app/URL used or visited during the time recorded.
- Time Spent – shows the total time spent on an application or website.
- Percentage used – shows the percentage of the line item over the total time tracked against all apps or URLs.
Manual time edits
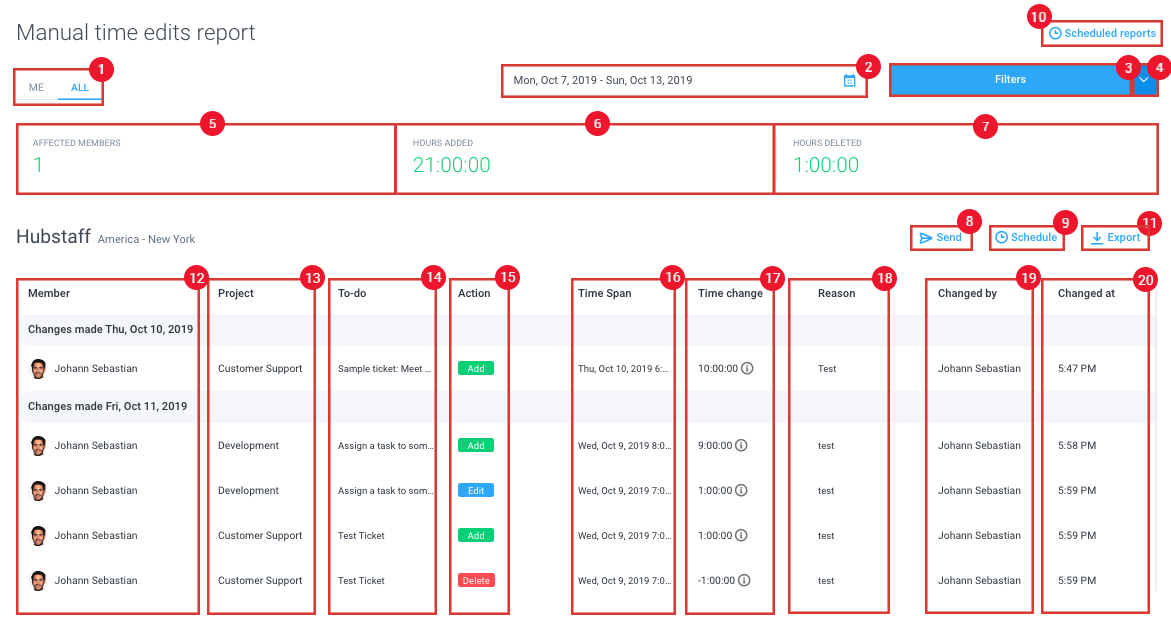
The Manual time edits report displays all the modifications made to the activities recorded on your account or organization.
This report can be accessed by navigating to Reports > General > Manual time edits.
This includes the time that was added, edited, or removed within your account (user) or within the organization (owners). Here you can also see which users modified the time and when it was added/edited/deleted.
To enable/disable the Modify Time setting, click here.
-
- Me/All tabs – the “Me” tab shows data for yourself as a user, and the “All” tab will display all data you have access to within your organization. If you are a project manager, you’ll be able to view data for all the projects where you are a member. If you are the organization owner, you’ll be able to view all data within the organization.
- Calendar – lets you select the date range for the data you wish to report.
- Filters – clicking on the Filter button will let you choose which filters you’d like to apply. For this report, you can filter the data by item type (Apps, URLs, Apps & URLs), projects, and members. You can also click on the “Save Filters” button to save your current filters. To view totals, you can toggle the “Sum date ranges” setting.

- Saved Filters – lets you apply saved filters to generate a custom report.
- Affected members – shows the total number of members on the report.
- Hours added – shows the total number of hours manually added.
- Hours deleted – shows the total hours removed.
- Send – lets you send the generated report to an email recipient. You can send the reports to multiple recipients by separating email addresses with commas.

- Schedule – allows you to schedule a report to be sent. You can choose to send the report in CSV or PDF formats, add a report name, and choose the date range, frequency, and delivery time of the report.

- Scheduled reports – opens the “Scheduled Reports” page, which displays all scheduled reports for your organization.
- Export – lets you export the generated report in CSV or PDF format.
- Member – the name of the member whose time was modified.
- Project – the name of the project where the modified time is assigned.
- To-do – the name of the task/to-do where the modified time is assigned.
- Actions – shows the specific change on the time block. Depending on the change made, the modified time is labeled: Add, Edit, or Delete.
- Timespan – shows the original time span before it was changed.
- Time change – shows the total time change.
- Reason – shows the reason added by the user who modified the time.
- Changed by – shows the user who modified the time.
- Changed at – shows the specific date the time was modified.
Timesheet approval
The Timesheet Approvals report displays a rundown of timesheet data as well as its current status.
This report can be accessed by navigating to Reports > Timesheet Approvals.
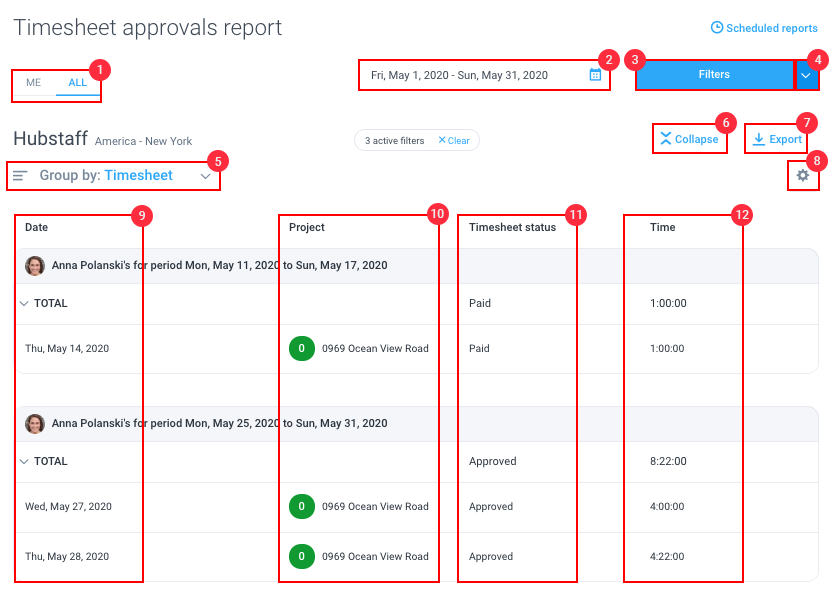
- Me/All tabs – the Me tab shows data for yourself as a user, and the All tab will display all data you have access to within your organization. If you are a project manager, you’ll be able to view data for all the projects where you are a member. If you are the organization owner, you’ll be able to view all data within the organization.
- Calendar – lets you select the date range for the data you wish to report.
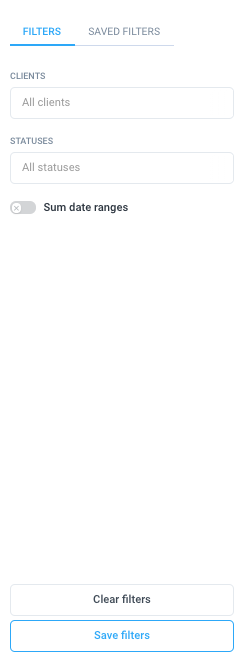
- Filters – clicking on the Filter button will let you choose which filters you’d like to apply. For this report, you can filter the data by Members and Statuses. You can also click on the Save Filters button to save your current filters. To view totals, you can toggle the Sum date ranges setting.
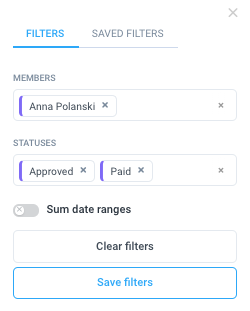
- Saved Filters – lets you apply saved filters to generate a custom report.
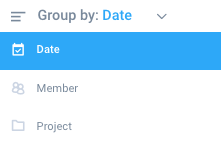
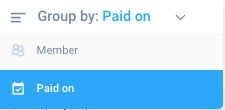
- Group by filter – this report can be grouped by either the Date or Member.
- Collapse – minimizes the report to only show totals.
- Export – lets you export the generated report in CSV format.
- Report columns – allows you to add/remove columns to the report.

- Date – shows the date an action was made against a timesheet.
- Project – shows the projects logged within a timesheet.
- Timesheet Status – shows the current status of the timesheet. This can either be Open, Submitted, Approved, Denied, or Paid.
- Time – shows the total time logged against a pay period.
Expenses
The Expenses report displays expense data by date and time, and can also be filtered based on billable and non-billable items.
This report can be accessed by navigating to Reports > General > Expenses.

- Me/All tabs – the Me tab shows data for yourself as a user, and the All tab will display all data you have access to within your organization. If you are a project manager, you’ll be able to view data for all the projects where you are a member. If you are the organization owner, you’ll be able to view all data within the organization.
- Calendar – lets you select the date range for the data you wish to report.
- Filters – clicking on the Filter button will let you choose which filters you’d like to apply. For this report, you can filter the data by Projects, Members, Categories, and Billing Type. You can also click on the Save Filters button to save your current filters.

- Saved Filters – lets you apply saved filters to generate a custom report.
- Expenses summary – shows the total number of expenses logged within the date range selected.
- Amount – shows the total amount of expenses within a time period.
- Group by filter – this report can be grouped by either the Date or Member.
- Collapse – minimizes the report to only show totals.
- Send – sends the report to a specific email recipient.
- Schedule – schedules the report to be sent within specific times and intervals.
- Export – lets you export the generated report in CSV or PDF format.
- Report columns – allows you to add/remove columns to the report.
- Member name – the name of the member who tracked the expense.
- Project name – the project under which the expense is logged.
- Expense Description – any notes added to the expense logged.
- Amount – the total amount of the expense.
- Category – shows the type of expense.
Work Breaks
The Work breaks report lets you view and track your team’s break times. To learn more about work breaks, please visit: Work Breaks in Hubstaff
This report can be found by navigating to Reports > General > Work breaks.

- Me/All tabs – the “Me” tab shows data for yourself as a user, and the “All” tab will display all data you have access to within your organization. If you are the organization owner, you’ll be able to view all data within the organization.
- Calendar – lets you select the date range for the data you wish to report.
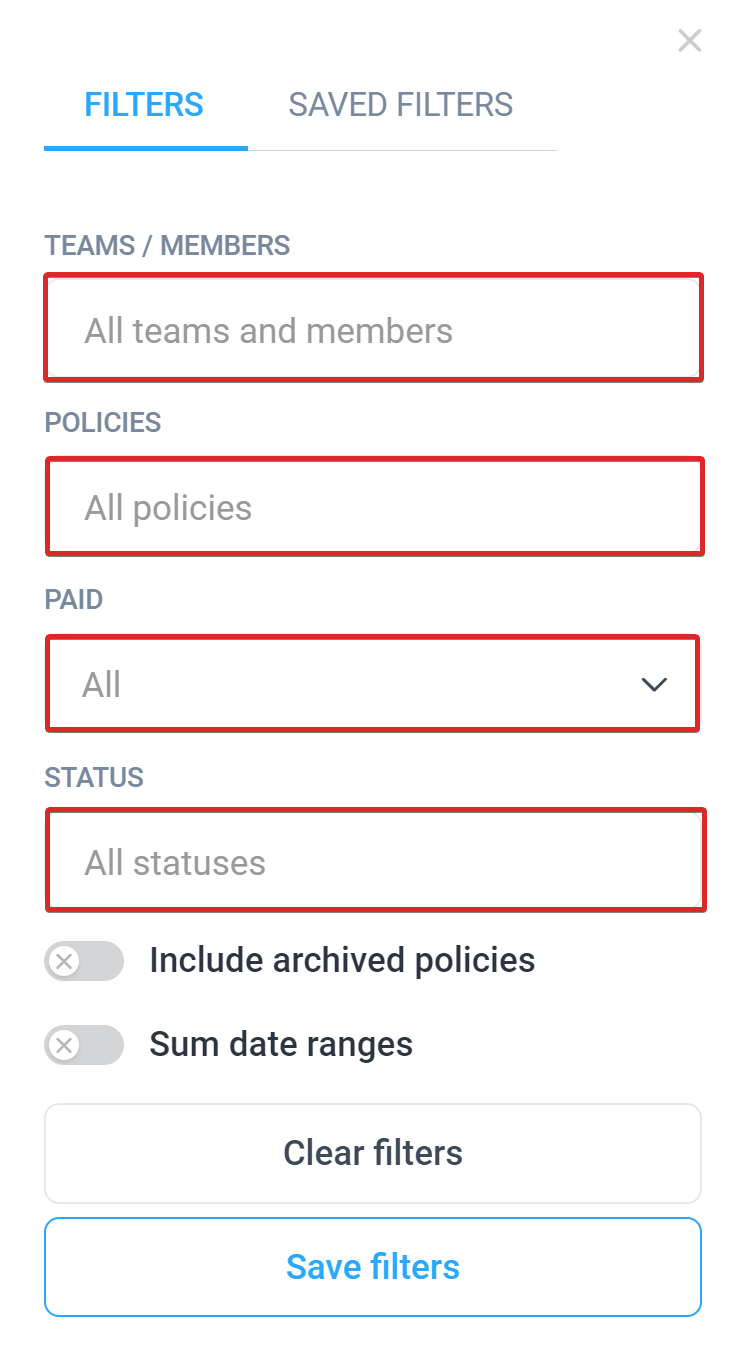
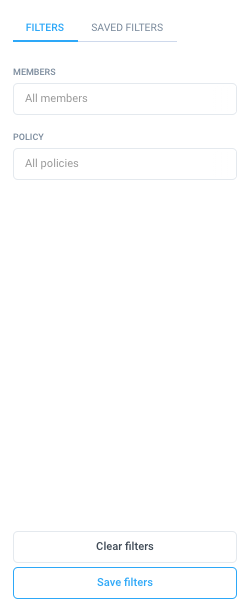
- Filters – clicking on the Filter button will let you choose which filters you’d like to apply. For this report, you can filter the data by teams/members, policies, status, and whether it’s paid or not. You can also include archived policies and click on Save Filters to save your current filters.
- Group by Filter – presents the data grouped based on the selected filter. This report can be grouped by member, date, or policy.
- Collapse – minimizes the report to only show totals.
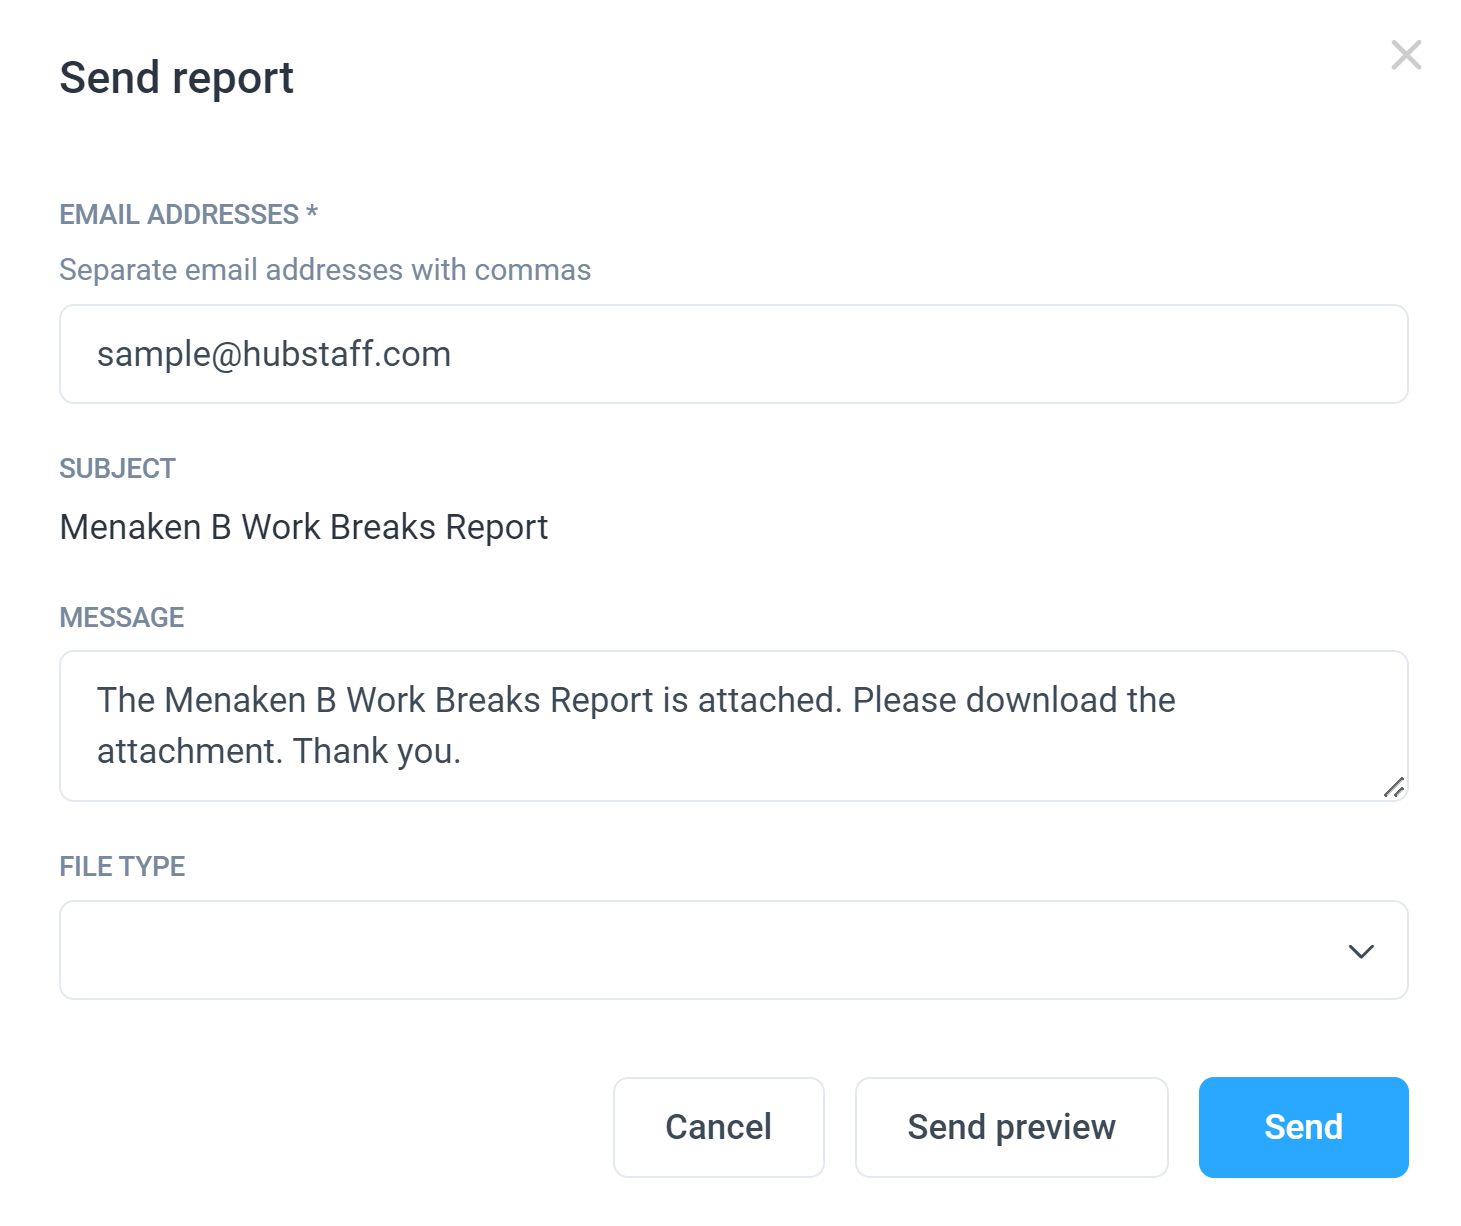
- Send – lets you send the generated report to an email recipient. You can send the reports to multiple recipients by separating email addresses with commas.
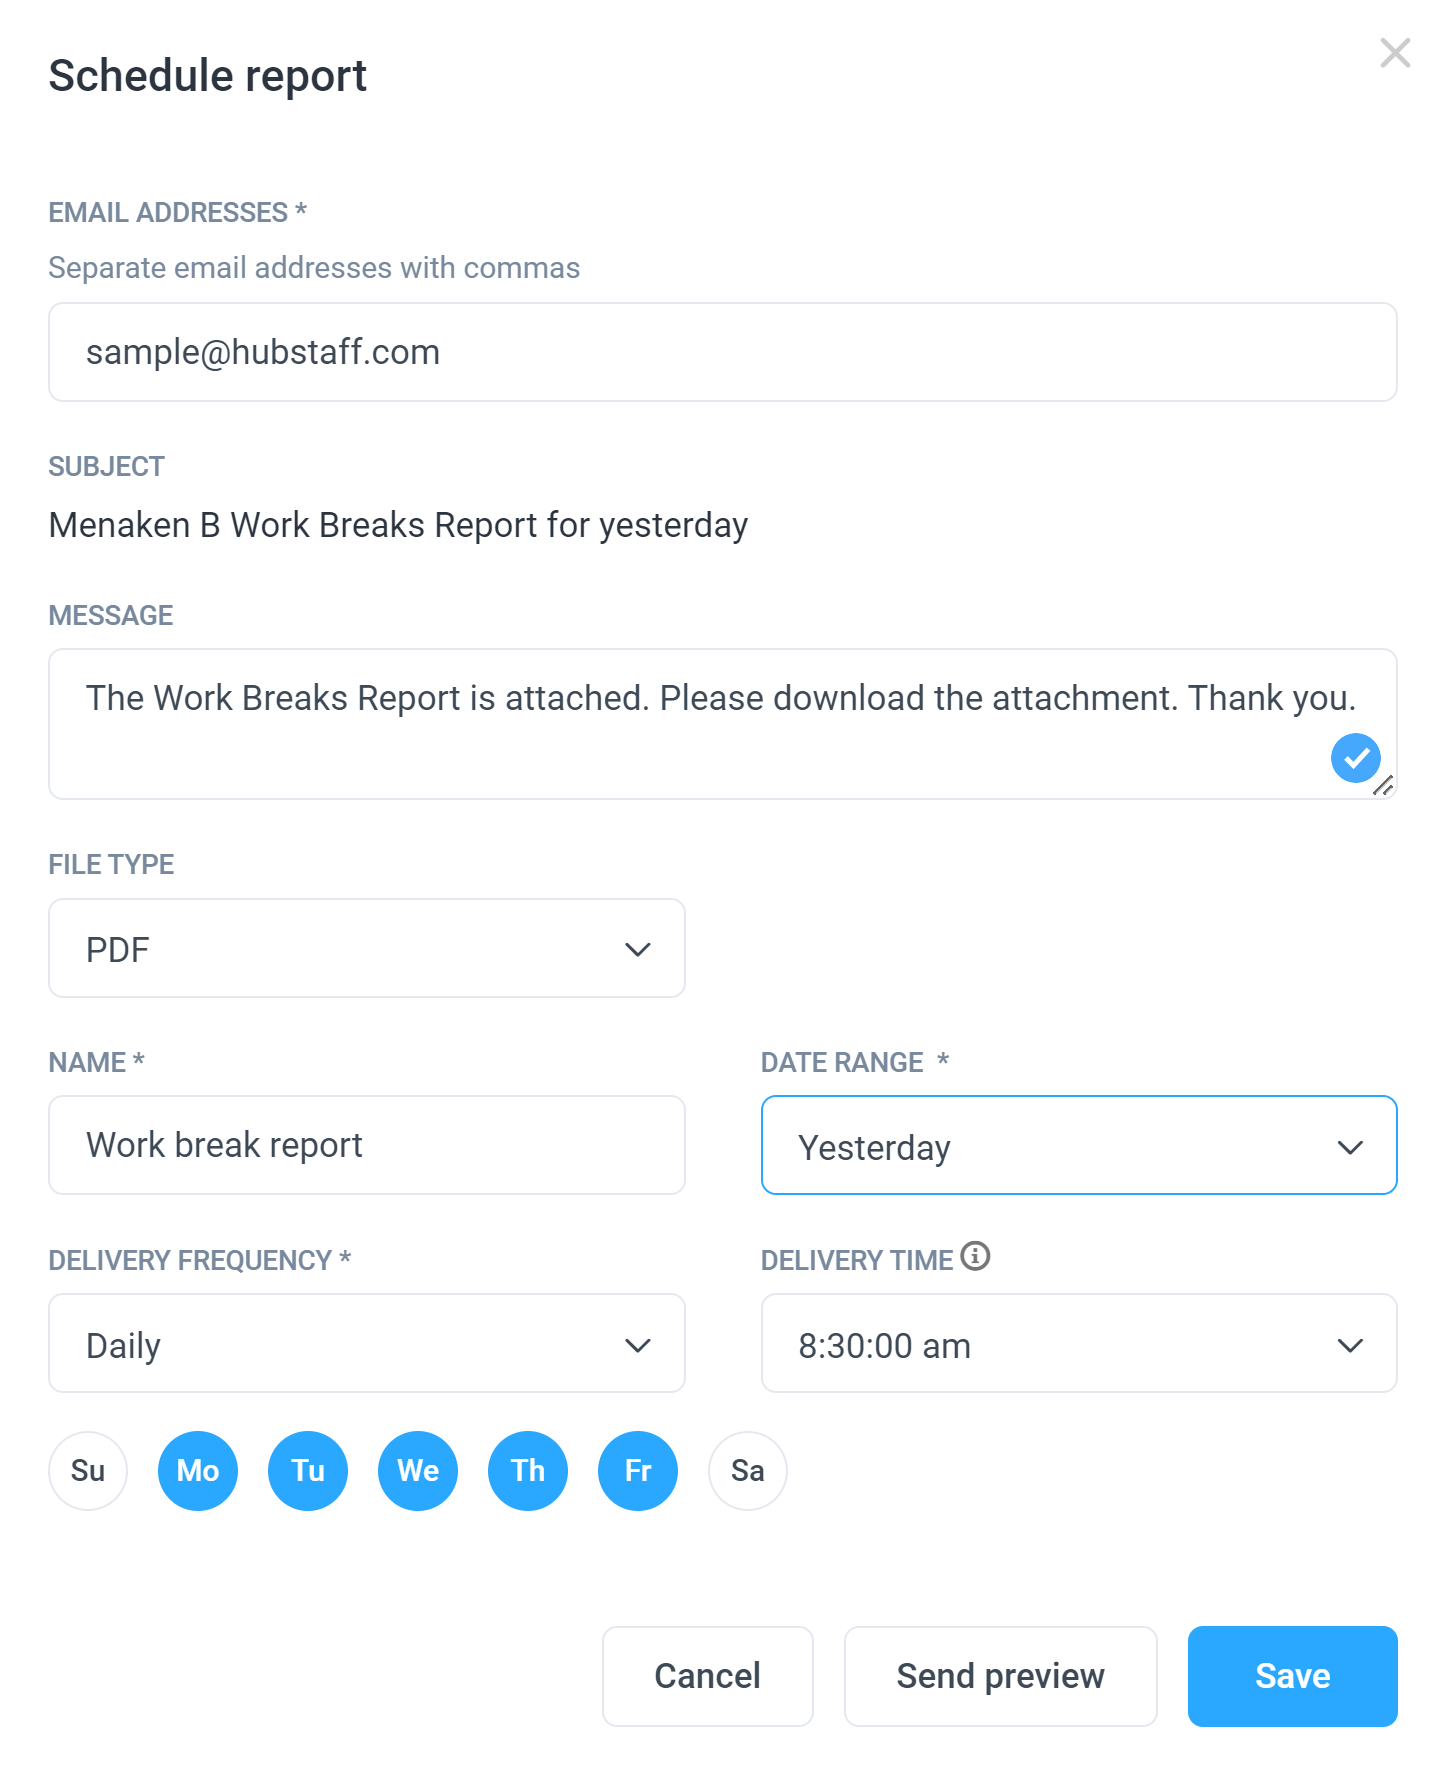
- Schedule – allows you to schedule a report to be sent. You can choose to send the report in CSV or PDF formats. Add a report name, and choose the date range, frequency, and delivery time of the report, then click Save.
- Export – lets you export the generated report in CSV or PDF format.
- Report columns – allows you to add/remove columns to the report. You can select to add or remove the columns: Status, Started, Ended, Allowed Hours, Actual Hours, and Paid Hours, as shown in 12.
- Members – displays the names of the member/s who tracked time to a work break. This column does not change
- Policy– displays the name of the policy the member has tracked time to. This column changes to date when the report is grouped by policy.
- Variable columns– display the variables that allow you to adjust your report further. The columns are:
- Status- whether the break is missed or ended on time.
- Started-what time the break began.
- Ended-what time the break stopped.
- Allowed Hour – the total hours allowed in a break.
- Actual Hours – the actual number of hours tracked to the work break.
- Paid Hours – total amount of time to be paid in a work break.
Audit log
The Audit log report lets you view who and what important changes were made to your organization.
This report can be accessed by navigating to Reports > General > Audit log.
Click here to learn more.

Payment
Amounts owed
The Amounts owed report displays all the time that is marked as unpaid within the organization.
This report can be accessed by navigating to Reports > Payment > Amounts owed.
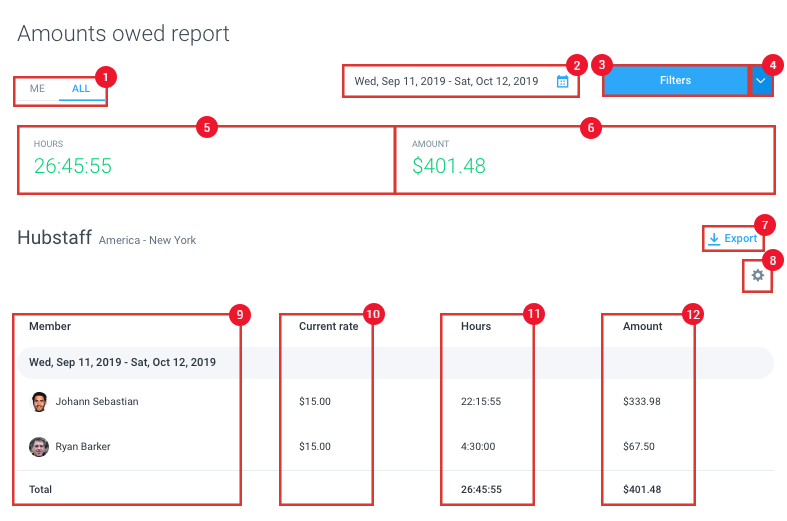
- Me/All tabs – the “Me” tab shows data for yourself as a user, and the “All” tab will display all data you have access to within your organization. If you are a project manager, you’ll be able to view data for all the projects where you are a member. If you are the organization owner, you’ll be able to view all data within the organization.
- Calendar – lets you select the date range for the data you wish to report.
- Filters – clicking on the Filter button will let you choose which filters you’d like to apply. For this report, you can filter the data by projects and members. You may also click on the “Save Filters” button to save your current filters. To view totals, you can toggle the “Sum date ranges” setting.
- Saved Filters – lets you apply saved filters to generate a custom report.
- Hours – shows the total unpaid hours within the organization.
- Amount – shows the total unpaid amount based on total hours multiplied by each team member’s pay rate.
- Export – lets you export the generated report in CSV or PDF format.
- Report columns – allows you to add/remove columns to the report.

- Member
- Current Rate – shows the pay rate assigned per team member.
- Hours – shows the total amount of unpaid time for each team member.
- Amount – shows the total unpaid amount for each member, as well as a total at the bottom of the report.
Payments
The Payments report shows a list of all payments made within the organization.
This report can be accessed by navigating to Reports > Payment > Payments.
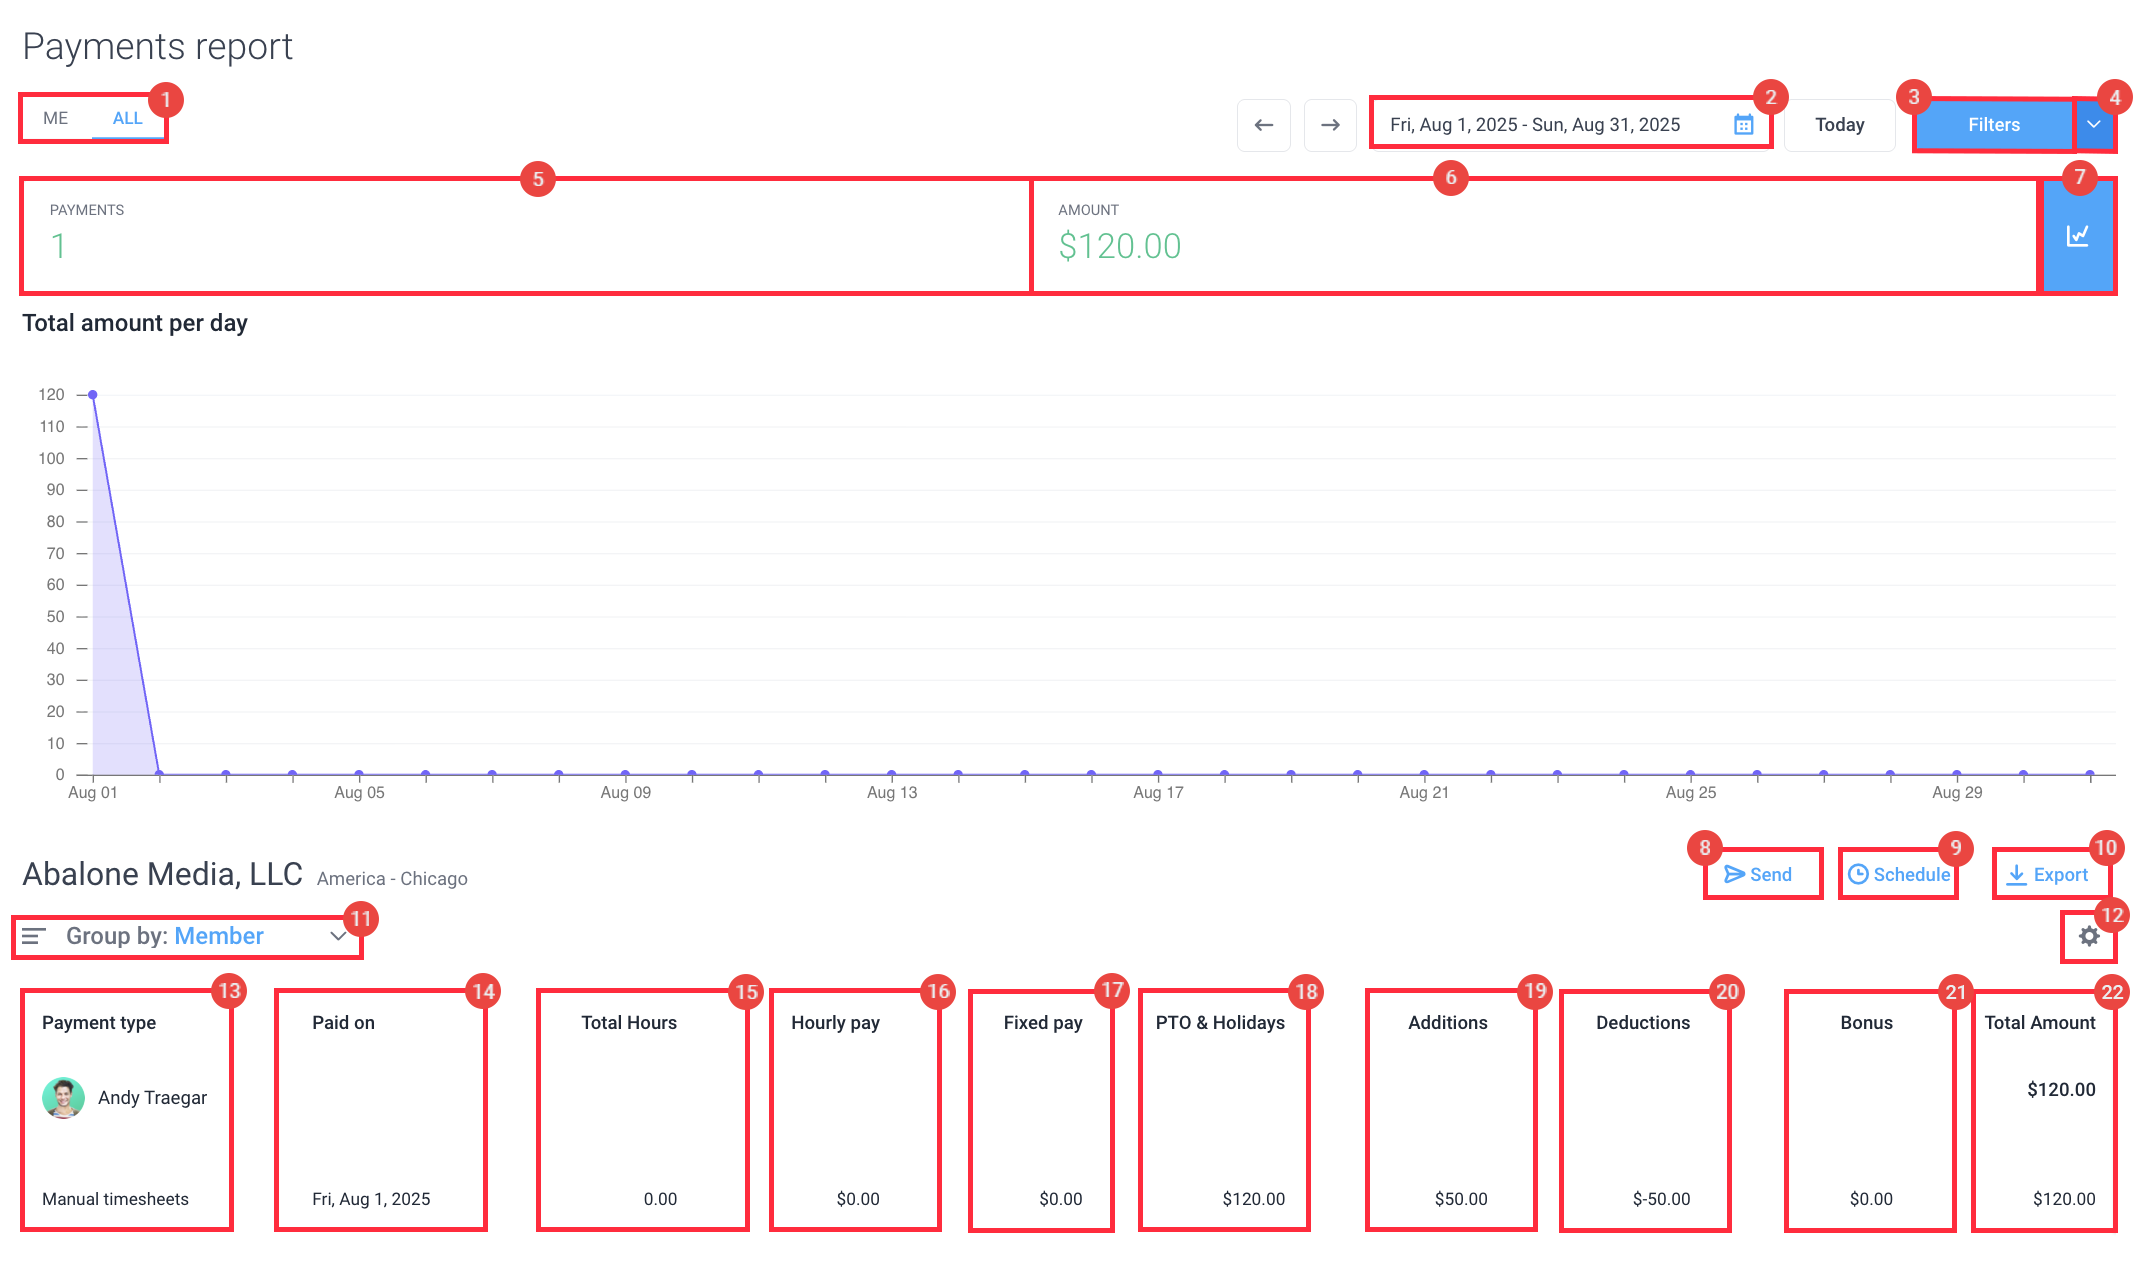
- Me/All tabs – the “Me” tab shows data for yourself as a user, and the “All” tab will display all data you have access to within your organization. If you are a project manager, you’ll be able to view data for all the projects where you are a member. If you are the organization owner, you’ll be able to view all data within the organization.
- Calendar – lets you select the date range for the data you wish to report.
- Filters – clicking on the Filter button will let you choose which filters you’d like to apply. For this report, you can filter the data by projects and members. You may also click on the “Save Filters” button to save your current filters. To view totals, you can toggle the “Sum date ranges” setting.

- Saved Filters – lets you apply saved filters to generate a custom report.
- Payments – Number of payments made within the selected date range.
- Amounts – Total amount of payments made within the selected date range.
- Graphs – show you a daily trend graph based on the data range selected.
- Send – allows you to send the report to an email recipient.
- Schedule – allows you to send a scheduled report.
- Export – lets you export the generated report in CSV or PDF format.
- Group by Filter – presents the data grouped based on the selected filter.
- Report columns – allows you to add/remove columns to the report.
- Payment type – shows whether the payment was made automatically or manually.
- Paid on – the date when the payment was made.
- Payment type – one-time payment, manual, or automatic payments.
- Paid on – the date the amount was paid.
- Total hours – total hours worked during the pay period.
- Hourly pay – hourly rate during the pay period.
- Fixed pay – fixed payment rate during the pay period.
- PTO & Holidays – payment for time offs and holidays.
- Additions – column for manual additions.
- Deductions – column for manual deductions.
- Bonus – payment for bonuses during the pay period.
- Total Amount – total amount paid.
Budgets and limits
Weekly limits
The Weekly Limits report displays the weekly limits set for each team member, as well as the time spent and time remaining against each weekly limit set.
This report can be accessed by navigating to Reports > Budgets and Limits > Weekly limits.

- Me/All tabs – the “Me” tab shows data for yourself as a user, and the “All” tab will display all data you have access to within your organization. If you are a project manager, you’ll be able to view data for all the projects where you are a member. If you are the organization owner, you’ll be able to view all data within the organization.
- Calendar – lets you select the date range for the data you wish to report.
- Filters – clicking on the Filter button will let you choose which filters you’d like to apply. For this report, you can filter the data by projects and members. You may also click on the “Save Filters” button to save your current filters. To view totals, you can toggle the “Sum date ranges” setting.

- Saved Filters – lets you apply saved filters to generate a custom report.
- Export – lets you export the generated report in CSV or PDF format.
- Group by Filter – presents the data grouped based on the selected filter.
- Member
- Time Spent – shows the total time spent.
- Weekly Limit – shows the limit set for each user.
- Percentage Used – shows the percentage of the weekly limit that has been consumed.
- Remaining – shows the remaining time available on each user’s weekly limit.
Project budgets
The project budgets report will display the budgets set for each project, the time spent on each project, as well as the remaining time available on each project, which helps you keep on top of your expenses.
This report can be accessed by navigating to Reports > Budgets and Limits > Project budgets.
This report is only accessible to organization owners.
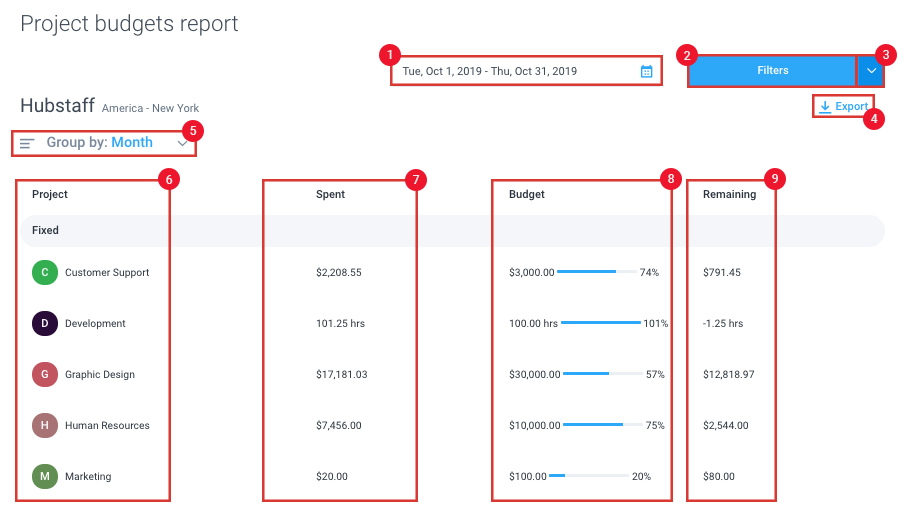
- Calendar – lets you select the date range for the data you wish to report.
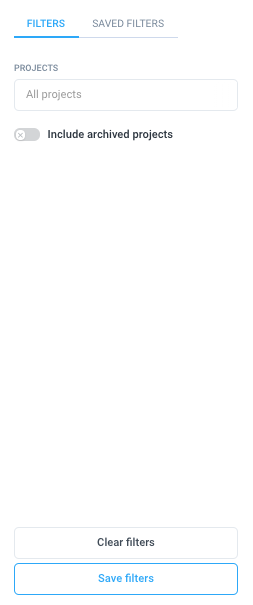
- Filters – clicking on the Filter button will let you choose which filters you’d like to apply. For this report, you can filter the data by projects and choose whether to include archived projects in the report.
- Saved Filters – lets you apply saved filters to generate a custom report.
- Export – lets you export the generated report in CSV or PDF format.
- Group by Filter – presents the data grouped based on the selected filter.

- Project – shows the project name.
- Spent – shows the amount spent on each project.
- Budget – shows the current budget for each project as well as the percentage used.
- Remaining – shows the remaining budget for each project.
Client budgets
The client budgets report will display the budgets set for all projects associated with a client, the time spent on each project, and the remaining time available on each client budget.
This report can be accessed by navigating to Reports > Budgets and Limits > Client budgets.
This report is only accessible to organization owners.

- Calendar – lets you select the date range for the data you wish to report.
- Filters – clicking on the Filter button will let you choose which filters you’d like to apply. For this report, you can filter the data by projects and choose whether to include archived projects in the report.
- Saved Filters – lets you apply saved filters to generate a custom report.
- Export – lets you export the generated report in CSV or PDF format.
- Group by Filter – presents the data grouped based on the selected filter.

- Client – shows the client’s name.
- Spent – shows the amount spent on each client.
- Budget – shows the current budget for each client as well as the percentage used.
- Remaining – shows the remaining budget for each client.
Time off
Time off balances
The Time-off balances report displays all available, used, and pending balances on each time-off policy.
This report can be accessed by navigating to Reports > Time Off > Time off balances.

- Me/All tabs – the “Me” tab shows data for yourself as a user, and the “All” tab will display all data you have access to within your organization. If you are a project manager, you’ll be able to view data for all the projects where you are a member. If you are the organization owner, you’ll be able to view all data within the organization.
- Calendar – allows you to choose the calendar year you’d like to view data for.
- Filters – clicking on the Filter button will let you choose which filters you’d like to apply. For this report, you can filter the data by Member and/or time off policy.
- Saved Filters – lets you apply saved filters to generate a custom report.
- Export – lets you export the generated report in CSV or PDF format.
- Group by Filter – presents the data grouped based on the selected filter. By default, this is set to “Member.”
- Policy – shows the name of the Time Off policy available for each team member.
- Used – shows the hours used on the specific policy.
- Pending – shows the available time off hours that are currently in the Pending state, which means time off requests that haven’t been approved.
- Balance – shows the remaining time off balance for each policy.
Time off transactions
The Time Off Balances report displays all approved Time Off requests.
This report can be accessed by navigating to Reports > Time Off > Time off transactions.
![]()
Invoice
Client invoices
The Client invoices report displays all invoices sent to clients.
This report can be accessed by navigating to Reports > Invoice– Client invoices.

- Calendar – allows you to choose the date range for the report.
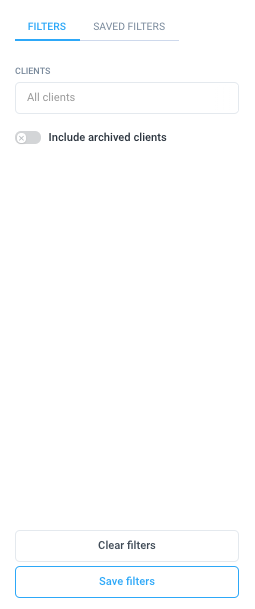
- Filters – clicking on the Filter button will let you choose which filters you’d like to apply. For this report, you can filter the data by client and/or the status of the invoice.
- Saved Filters – lets you apply saved filters to generate a custom report.
- Export – lets you export the generated report in CSV or PDF format.
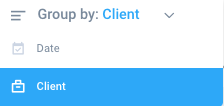
- Group by Filter – presents the data grouped based on the selected filter. By default, this is set to “Member.”
- Issue date – shows the date when the invoice was issued.
- Invoice – displays the invoice number.
- Status – displays the current status of the invoice (Open/Closed).
- Invoice total – shows the total amount posted on the invoice.
- Paid – shows the amount paid by the client.
- Amount due – shows the total amount due. If the invoice is paid, the amount will be 0. When unpaid, it will display the invoice total.
Team invoices
The Team invoices report displays all invoices sent by all team members.
This report can be accessed by navigating to Reports > Invoice > Team invoices.

- Me/All tabs – the “Me” tab shows data for yourself as a user, and the “All” tab will display all data you have access to within your organization. If you are a project manager, you’ll be able to view data for all the projects where you are a member. If you are the organization owner, you’ll be able to view all data within the organization.
- Calendar – allows you to choose the calendar dates you’d like to view data for.
- Filters – clicking on the Filter button will let you choose which filters you’d like to apply. For this report, you can filter the data by Member and/or time off policy.

- Saved Filters – lets you apply saved filters to generate a custom report.
- Export – lets you export the generated report in CSV or PDF format.
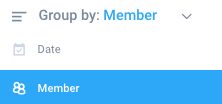
- Group by Filter – presents the data grouped based on the selected filter. By default, this is set to “Member.”
- Issue date – shows the date when the invoice was issued.
- Invoice – displays the invoice number.
- Status – displays the current status of the invoice (Open/Closed).
- Invoice total – shows the total amount posted on the invoice.
- Paid – shows the amount paid by the client.
- Amount due – shows the total amount due. If the invoice is paid, the amount will be 0. When unpaid, it will display the invoice total.
Client invoices aging
The Client invoices aging report shows you all unpaid invoices in a 90-day range, broken down every 30 days.
This report can be accessed by navigating to Reports > Invoice > Client invoices aging.
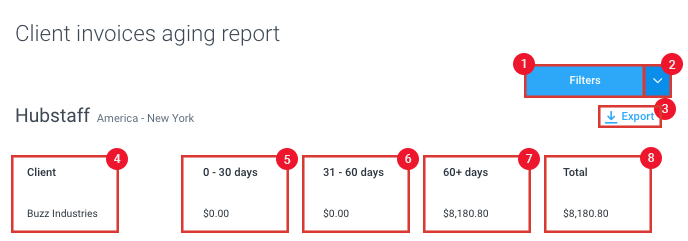
- Filters – clicking on the Filter button will let you choose which filters you’d like to apply. For this report, you can filter the data by Client.

- Saved Filters – lets you apply saved filters to generate a custom report.
- Export – lets you export the generated report in CSV or PDF format.
- Client – displays the client’s name.
- 0-30 days – shows the total amount of unpaid invoices within the past 30 days.
- 31-60 days – shows the total amount of unpaid invoices within the last 31-60 days.
- 61-90 days – shows the total amount of unpaid invoices within the last 61-90 days.
Team invoices aging
The team invoices aging report shows you all unpaid invoices for your team in a 90-day range, broken down every 30 days.
This report can be accessed by navigating to Reports > Invoice > Team invoices aging.
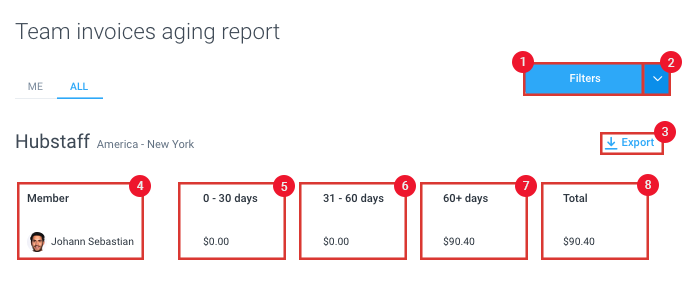
- Filters – clicking on the Filter button will let you choose which filters you’d like to apply. For this report, you can filter the data by Client.
- Saved Filters – lets you apply saved filters to generate a custom report.
- Export – lets you export the generated report in CSV or PDF format.
- Member – displays the team member’s name.
- 0-30 days – shows the total amount of unpaid invoices within the past 30 days.
- 31-60 days – shows the total amount of unpaid invoices within the last 31-60 days.
- 61-90 days – shows the total amount of unpaid invoices within the last 61-90 days.
Schedule
Shift Attendance
The attendance report aids the Hubstaff scheduling feature for better schedule management.
This report can be accessed by navigating to Reports > Schedule > Attendance.

- Me/All tabs – the “Me” tab shows data for yourself as a user, and the “All” tab will display all data you have access to within your organization. If you are a project manager, you’ll be able to view data for all the projects where you are a member. If you are the organization owner, you’ll be able to view all data within the organization.
- Calendar – allows you to choose the days you’d like to view data.
- Filters – clicking on the Filter button will let you choose which filters you’d like to apply. For this report, you can filter the data by Member and/or Status.

- Not started – the user has not begun tracking time for their scheduled shift and the shift has not started yet.
- On-Time – the user was able to log in on time for their shift.
- Late – the user was tardy in coming in for their shift. The threshold for the late notification is set to 5 minutes.
- Abandoned – this means the employee failed to complete the shift schedule as it was set. For example, if you’ve created a shift schedule of 8 am-5 pm (9 hours) and set a minimum hour requirement of 9 hours, when a user has tracked time from 7:55 am – 4:55 pm, they will be marked as “abandoned shift” as they only tracked a total of 8 hours and 55 minutes within the shift and will receive an email confirming their attendance status.
- Missed – the user did not log in for their entire scheduled shift.
- Saved Filters – lets you apply saved filters to generate a custom report.
- Send – lets you send a one-time email of the report to a specific recipient.
- Schedule – creates a recurring scheduled email of the report to be sent to a specific email address.
- Export – lets you export the generated report in CSV or PDF format.
- Group by Filter – presents the data grouped based on the selected filter. By default, this is set to “Date.”
- Member – displays the team member’s name.
- Status – shows each team member’s attendance status.
- Shift – displays the schedule set for each team member for the specific date.
- Start time – shows the time the user started to track time.
- Required hours – shows the required hours set for the shift.
- Actual hours – shows the actual hours logged against the scheduled shift.
Job Attendance
The job attendance report works in conjunction with the work order feature.
To access the report, navigate to Reports > Schedules > Job attendance.
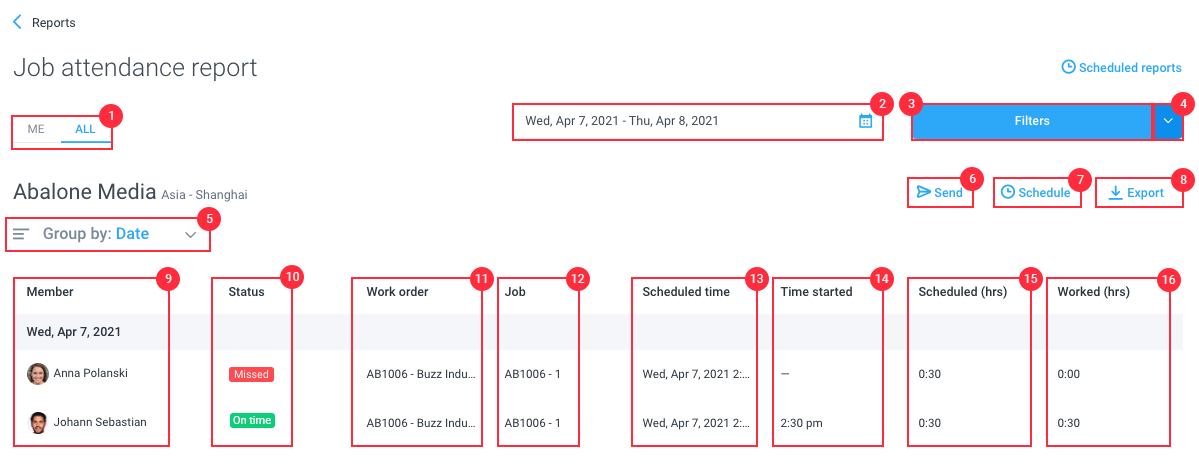
- Me/All tabs – the “Me” tab shows data for yourself as a user, and the “All” tab will display all data you have access to within your organization. If you are a project manager, you’ll be able to view data for all the projects where you are a member. If you are the organization owner, you’ll be able to view all data within the organization.
- Calendar – allows you to choose the days you’d like to view data.
- Filters – clicking on the Filter button will let you choose which filters you’d like to apply. For this report, you can filter the data by Member and/or Status.
- Not started – the user has not begun tracking time for their scheduled shift and the shift has not started yet.
- On-Time – the user was able to log in on time for their shift.
- Late – the user was tardy in coming in for their shift. The threshold for the late notification is set to 5 minutes.
- Abandoned – this means the employee failed to complete the shift schedule as it was set. For example, if you’ve created a shift schedule of 8 am-5 pm (9 hours) and set a minimum hour requirement of 9 hours, when a user has tracked time from 7:55 am – 4:55 pm, they will be marked as “abandoned shift” as they only tracked a total of 8 hours and 55 minutes within the shift and will receive an email confirming their attendance status.
- Missed – the user did not log in for their entire scheduled shift.
- Saved Filters – lets you apply saved filters to generate a custom report.
- Group by Filter – presents the data grouped based on the selected filter. By default, this is set to “Date.”
- Send – lets you send a one-time email of the report to a specific recipient.
- Schedule – creates a recurring scheduled email of the report to be sent to a specific email address.
- Export – lets you export the generated report in CSV or PDF format.
- Member – displays the team member’s name.
- Status – shows each team member’s attendance status.
- Work order – displays the work order name.
- Job – displays the job name under the work order.
- Scheduled time – displays the time the job is scheduled.
- Time started – shows the time the user started to track time against the job.
- Scheduled hours – shows the required hours set for the job.
- Worked hours – shows the actual hours logged against the scheduled job.
Job Sites
Visits
The Job Sites Visits reports display all tracked times by each team member within the range of a specific job site set.
This report can be accessed by navigating to Reports > Job Sites > Visits.
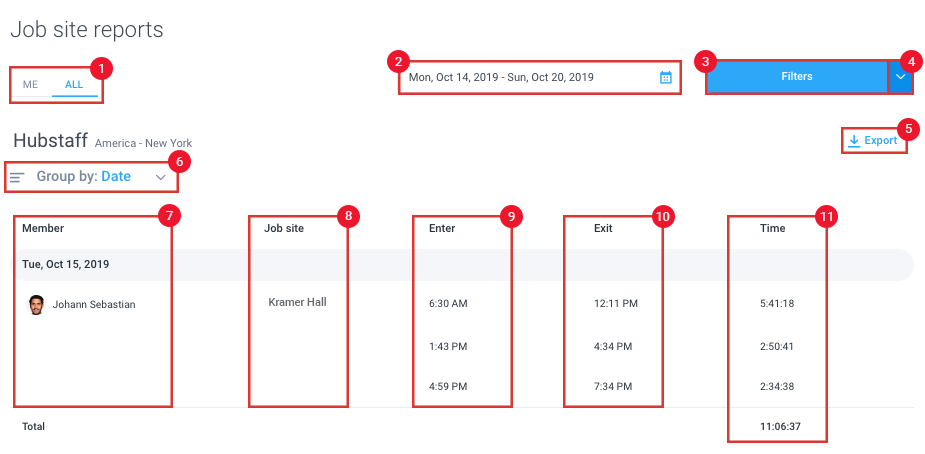
- Me/All tabs – the “Me” tab shows data for yourself as a user, and the “All” tab will display all data you have access to within your organization. If you are a project manager, you’ll be able to view data for all the projects where you are a member. If you are the organization owner, you’ll be able to view all data within the organization.
- Calendar – allows you to choose the days you’d like to view data.
- Filters – clicking on the Filter button will let you choose which filters you’d like to apply. For this report, you can filter the data by job sites and/or members.

- Saved Filters – lets you apply saved filters to generate a custom report.
- Export – lets you export the generated report in CSV or PDF format.
- Group by Filter – presents the data grouped based on the selected filter. By default, this is set to “Date.”
- Member – displays the team member’s name.
- Job site – displays the name of the job site.
- Enter – shows the exact time the user started tracking time on a job site.
- Exit – shows the exact time the user either stopped tracking or has left the range of the job site (if set to automatic).
- Time – shows the duration of time tracked.