11 minutes
Transitioning to the new Time and Activity Report
Get the same insights from your Legacy Time and Activity data in the new report, using the same workflows you’re used to. Familiar controls haven’t gone away; they’ve just moved. This article shows you exactly where to find them so you can do the same things you always did, in the new report.
How do I see days with and without tracked time in my report?
In the legacy report, a monthly view showed every day in the range by default, including days with no tracked time.
In the new report, the default view shows only days with activity. To see every day in your date range, whether time was tracked or not, you can follow these steps:
Step 1
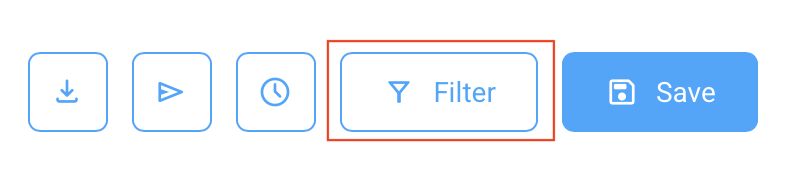
Open Filters.
Step 2
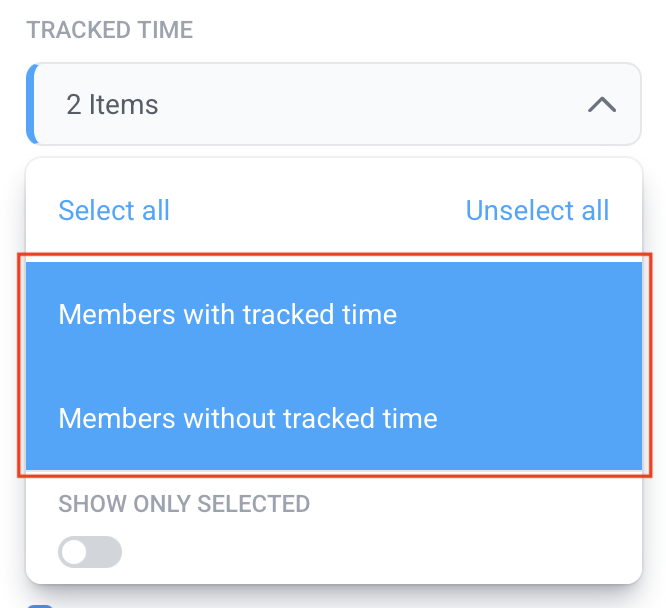
Under Tracked time, select both With tracked time and Without tracked time.
Step 3
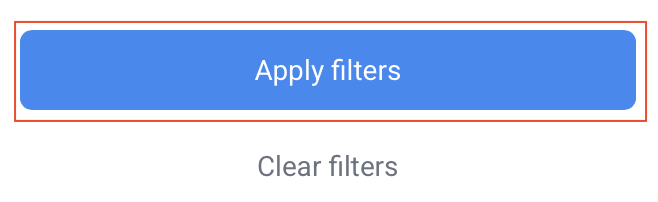
Click Apply filters.
How do I see the notes for the time tracked in my report?
If you rely on time entry notes for client billing or for context on the time tracked by your team, they haven’t gone away. You can obtain them in your reports by following these steps:
Step 1
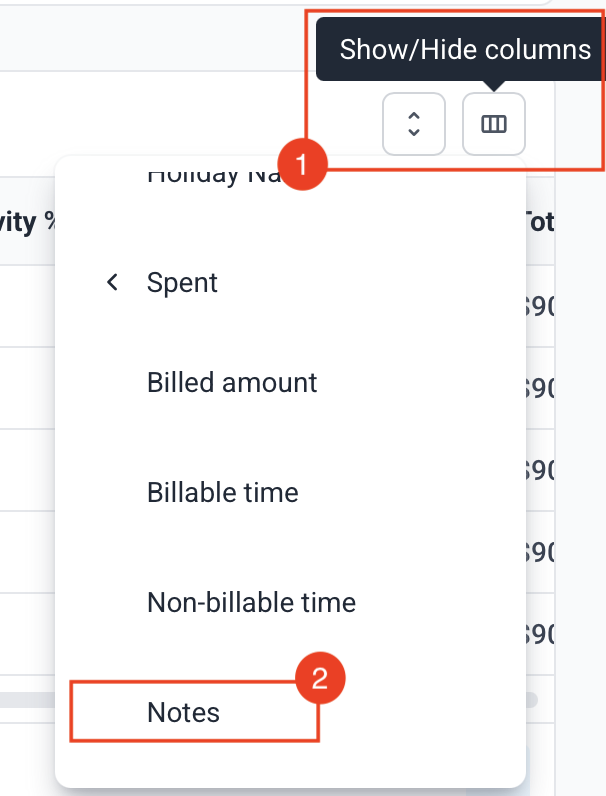
Click the Columns icon.
Step 2
Select Notes from the column list.
Step 3
Export the report as usual using Export.

How do I view time reassigned to a different project?
If you reassign tracked time from one project to another, the new report and its exports will reflect the updated project, not the original one. This section walks through a simple example so you can confirm this yourself.
Step 1
Open the Time and Activity report.
Step 2
Filter to the member and date range covering the reassigned time.
Step 3
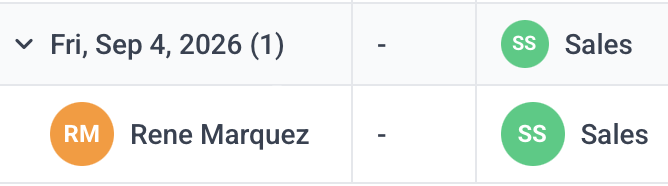
Check the project column. It shows the new project, not the original one.
Old project

New project
Step 4
Export the report, the new project will be reflected in the report.
How do I apply the filters to my report?
In the legacy report, filters applied as soon as you selected them. In the new report, selecting a filter does not apply it until you confirm. Follow the steps here to ensure your filters are applied and reflect on your reports.
Step 1
Click Filters.
Step 2
Select your filter criteria.
Step 3
Click Apply filters before closing the panel.
How do I see the projects I have in my filters?
When you filter by project, the filter can display a count, such as “1 project,” instead of the project name. This is expected, and you can still confirm exactly which project or projects are selected by following these steps:
Step 1
Open Filters and go to projects.
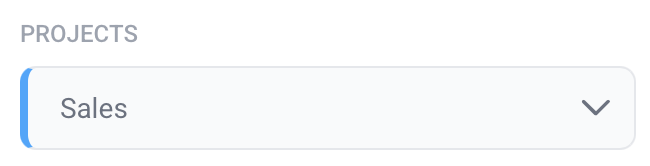
Step 2
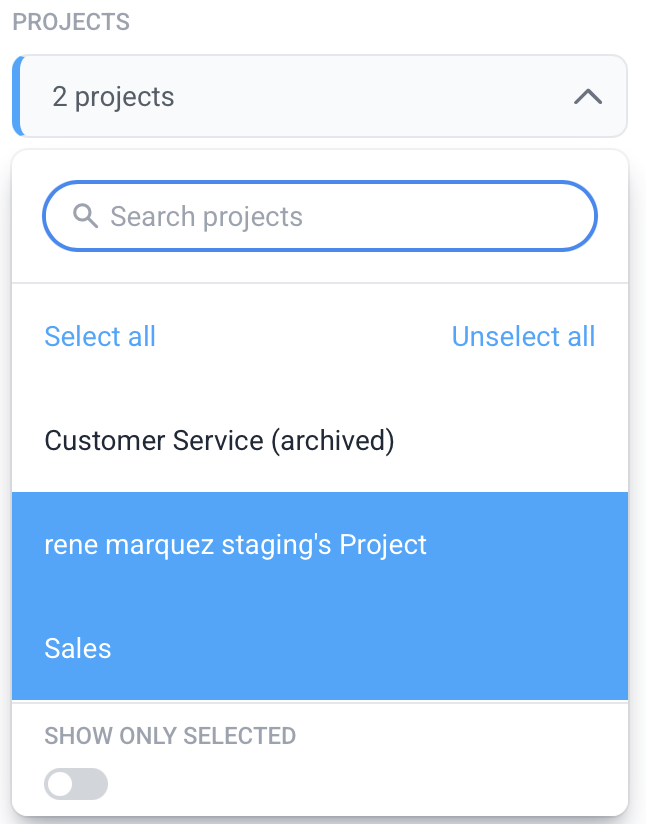
Select the project to filter by, if 2 or more projects are selected you will see “2 projects” when minimized.
Step 3
Click Apply filters.
How do I see the projects if I group the data by Member?
If you group the data by Member, the new report breaks the data down by date under each member by default. If you’re used to seeing the project details, this can be seen per day by clicking a date row to expand it:
Step 1
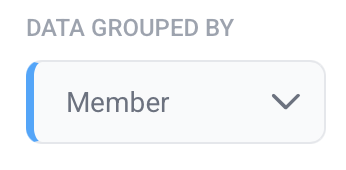
Set Group by to Member.
Step 2
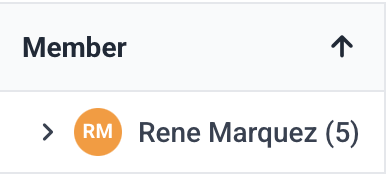
Click the name of the member to show the dates tracked.
Step 3
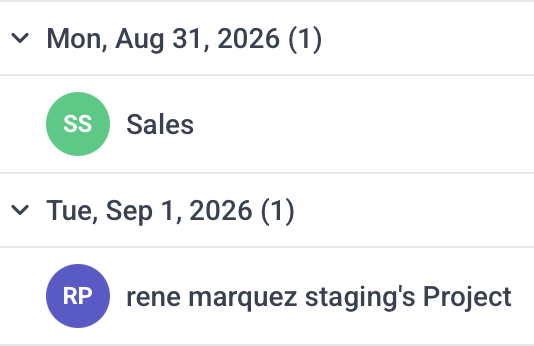
Click a date to expand it, the project detail for that date appears below it.
How can I export a detailed report?
To get a PDF export that has detailed information similar to what the legacy report produced, follow the steps below:
Step 1
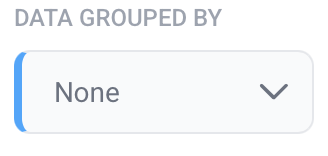
Set Group by to None.
Step 2
Add the columns you need from the column list.
Step 3
Use column sorting depending on the view needed.
Step 4
Click Export and choose PDF.