16 minutes
Hubstaff Time and Activity Report
You can also schedule reports to be sent directly to selected email inboxes at your preferred day and time. These scheduled reports can include time data and be sent to external recipients, such as clients or board members, even if they’re not part of your organization.
Generating the report
Step 1
Navigate to Reports > All reports.
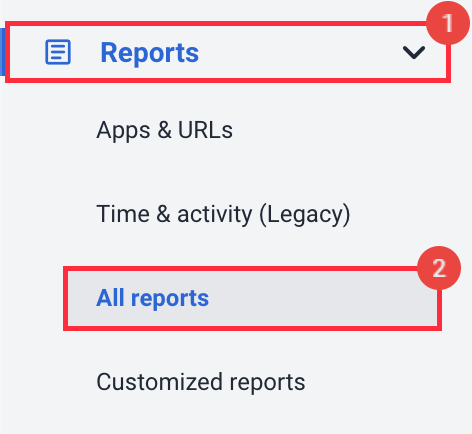
You can also access your custom reports, once saved, under the Customized Reports section.
Step 2
Click on Time & activity.

or Time & activity (Legacy), which is the older version of the report, under the General section.
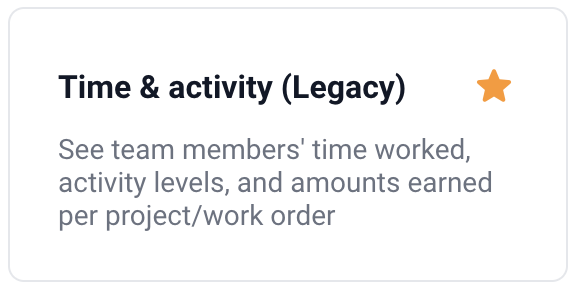
You can also star a report, so it appears on the menu bar for quick reference. Users can star up to 6 reports at a time.
Step 3
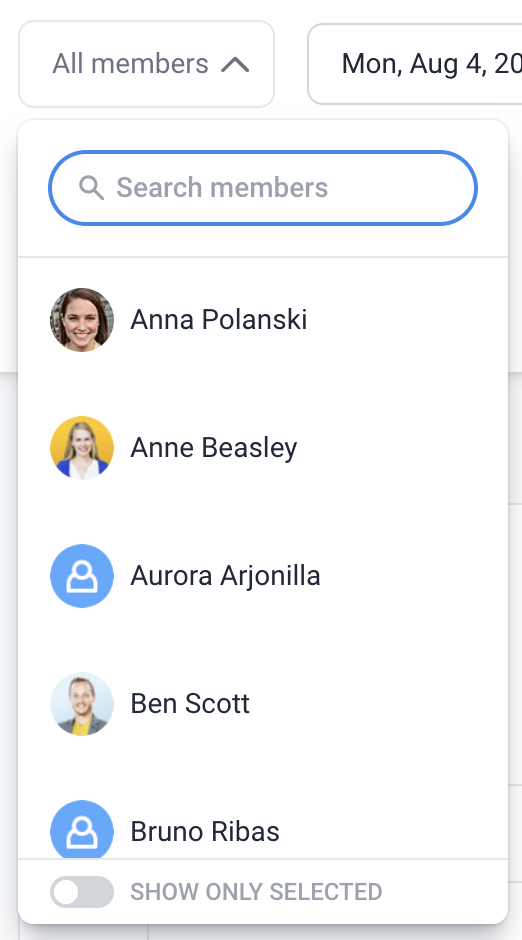
In the top left corner of the report header, you will see the Members filter, where you can choose whether to generate a report for yourself or your team.
Step 4
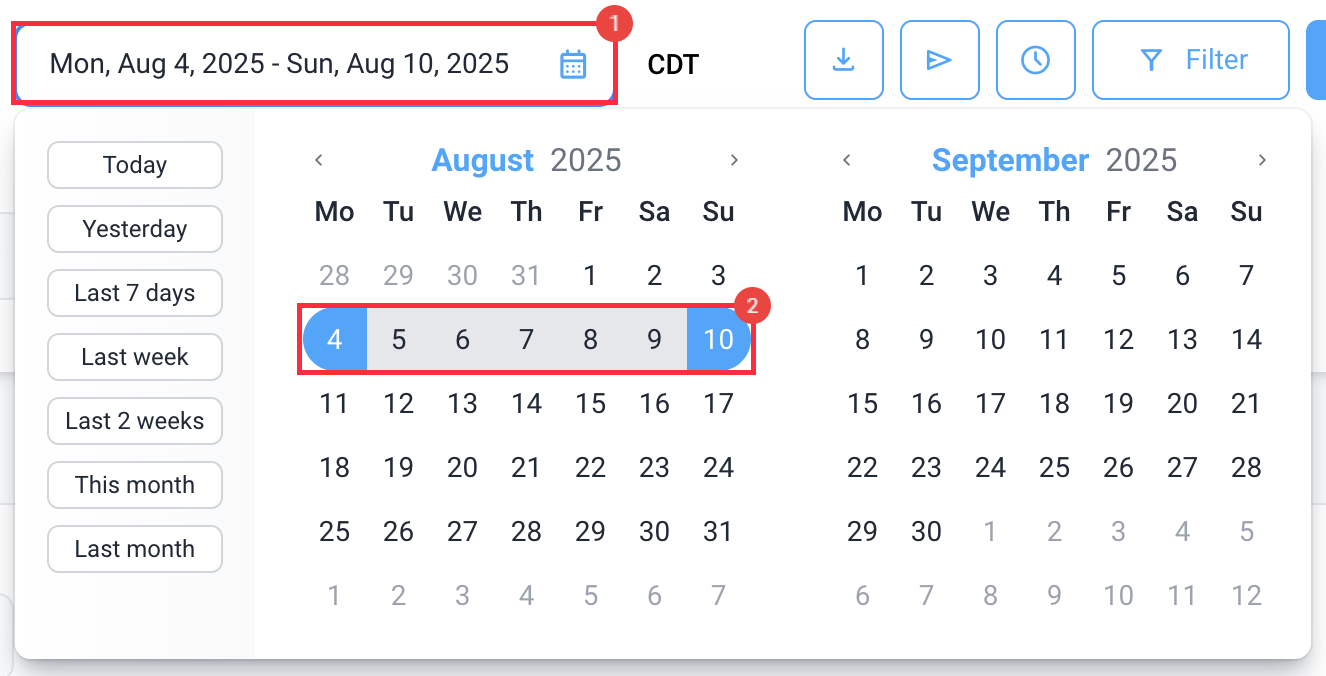
Select a custom date range from the calendar.
Step 5

Click on the Filter button to apply the following filters to your report:

- Members
- Projects/Work orders
- Teams
- Clients
- To-dos/Jobs
- Tracked time
You may also click on ‘+ Add Custom Filters’ to include additional criteria. The following options are available:
- Total hours
- Manual hours
- Regular hours
- Overtime hours
- Billable time
- Non-billable time
- Break time
- Activity %
- Idle (%)
- Idle (hr)
- Pay rate
- Billed amount
- Regular spent
- Overtime spent
- Total spent
Under the Settings section, you can also choose to include:
- Include archived projects
- Include removed members
- Show all time off / holidays
- Exclude work breaks
If you are looking for the tracked time of a member who was previously removed from the organization, their data will only show when filtering for dates on which they tracked time. First, select the correct timeframe from the date selector, then when using the “Filters” options, you will see their name in the “Members” list to select.
After applying the filters, your report will be generated automatically.
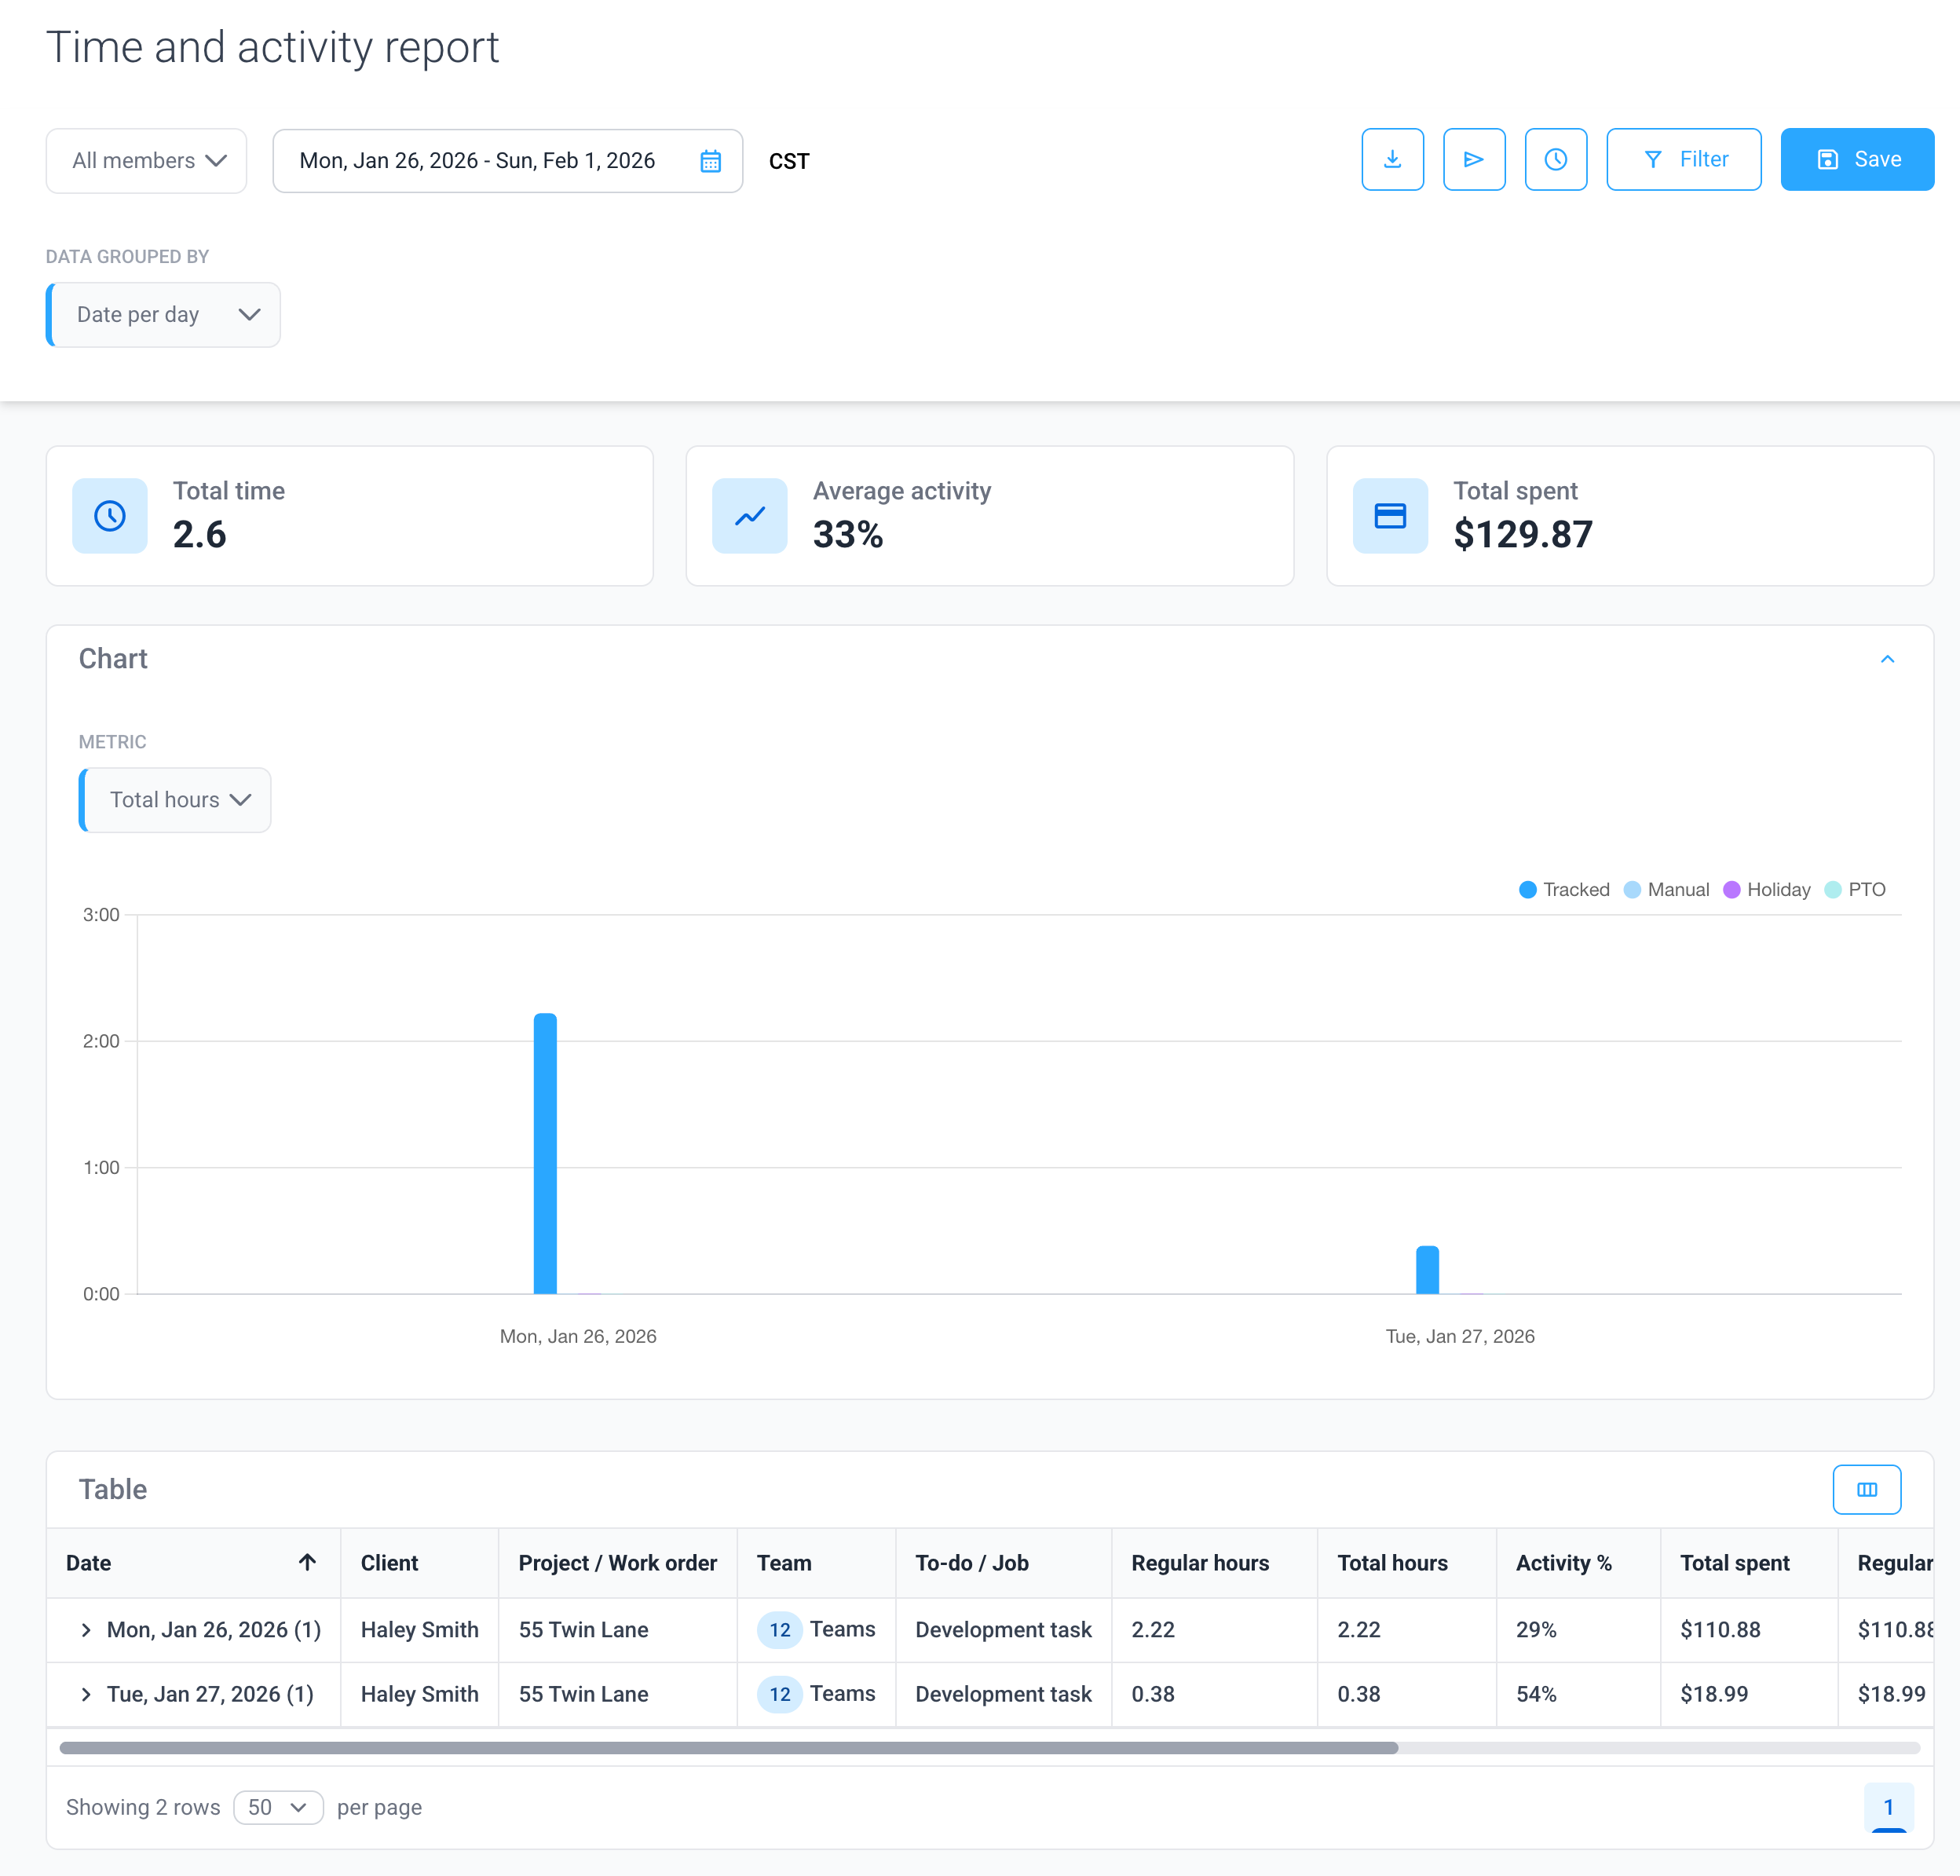
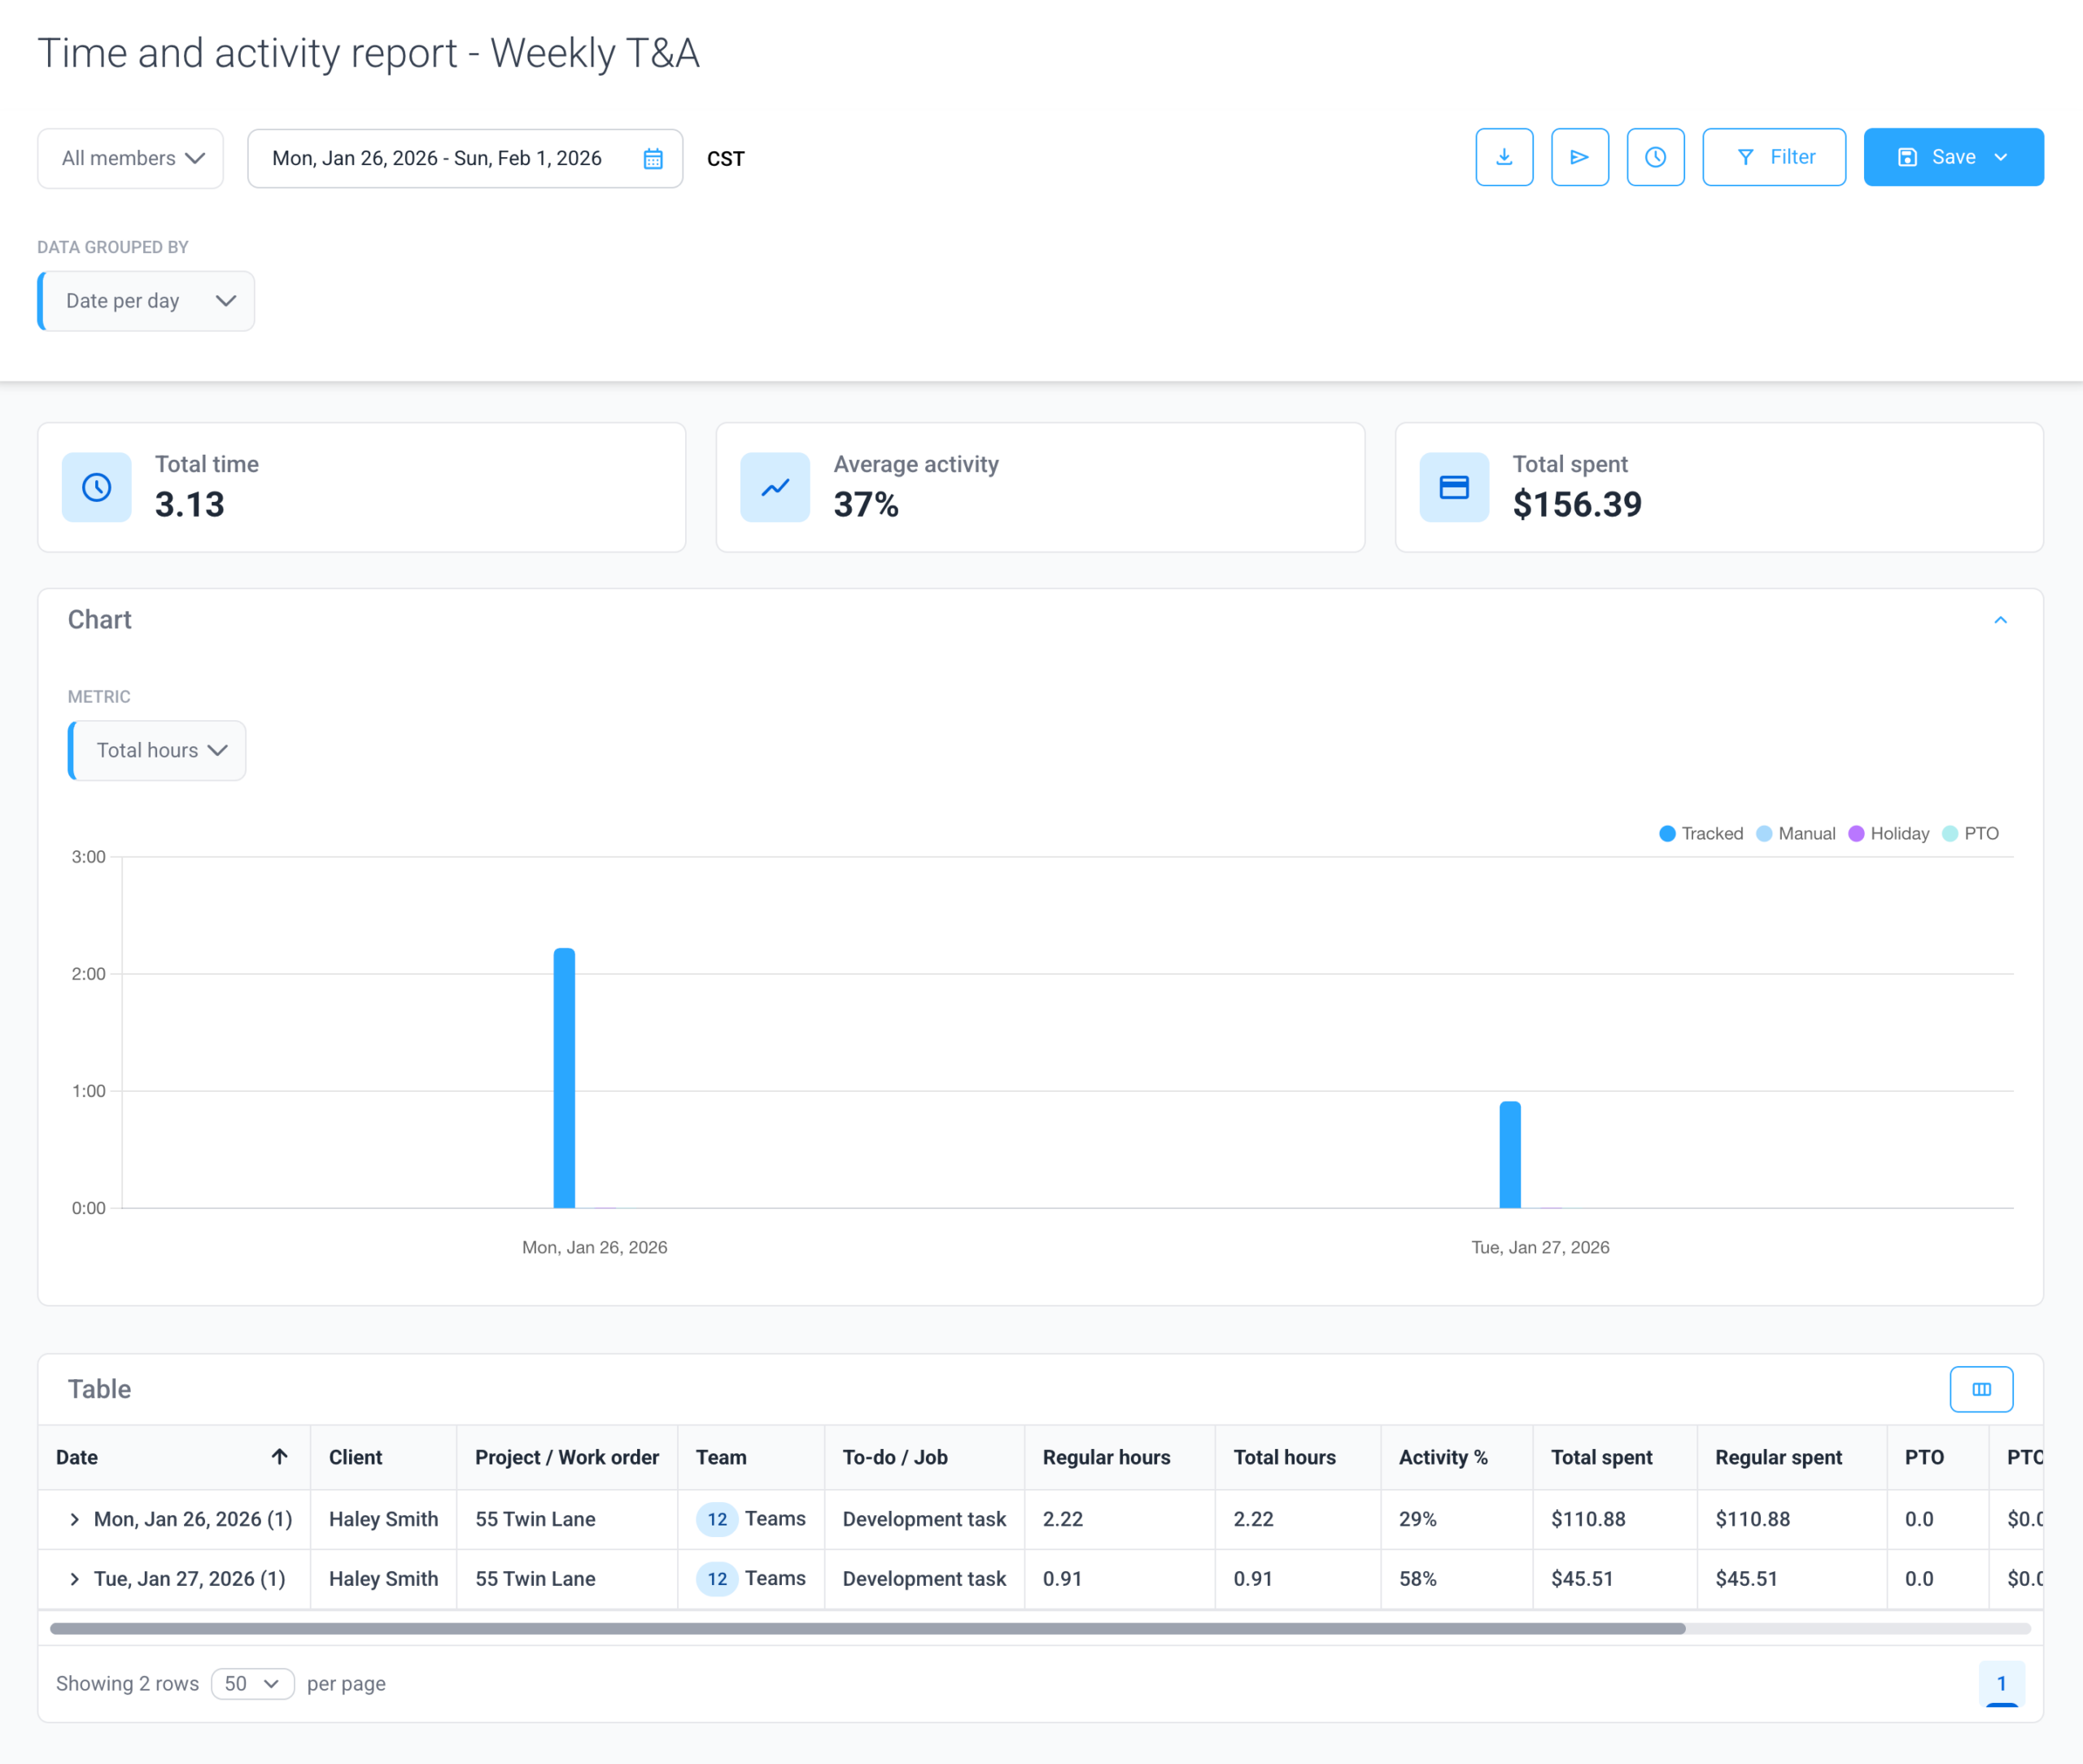
From here, you’ll see this information on top of the report:
- Total time – shows the total time tracked.
- Average activity – average level of recorded keyboard/mouse movement over time tracked for the selected duration.
- Total spent – total amount spent based on the team member’s pay rate.
Adding some columns will also add totals to the chart section of the report (e.g., Billed amount, Billable time, Non-billable time)

- You can also show <> hide the chart by clicking on the icon located on the chart’s top right corner.
- You can sort column data by clicking on the arrows located on the right-hand side of each column name.
- At the bottom of the report, you can also see rows per page, and towards the right-hand side, you’ll see pagination in case you have several rows that exceed those that can be displayed on one page.
Grouping Data
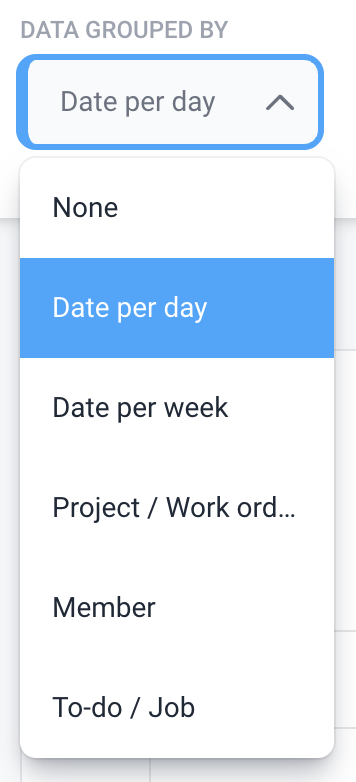
Click on the Group by dropdown to group the data by:
- None
- Date per day
- Date per week
- Project / Work order
- Member
- To-do / Job
- Team
- Client
Adding Columns
Click on the Columns icon on the right-hand side of the report to add/remove columns to your report.

Users can select items one by one or select all (e.g., within the Info section) to choose all available options.

Adding some columns will also add totals to the chart section of the report (e.g., Billed amount, Billable time, Non-billable time)
Sending Reports
Reports can be sent to one or more email recipients by clicking on the Send button.

Add the email recipients to the email addresses field, separating each email address with a comma, add an email subject, add a message (optional), then either send a test message by clicking the Send Preview button or click Send to send the report.

You can choose to either receive PDF or CSV attachments on the File Type dropdown. When downloading in CSV and the table is collapsed, you’ll see the sum total of the range.

Scheduling Reports

Owners, managers, and users can also schedule reports to be sent automatically by clicking on the Schedule button. After clicking the button, a dialog box will appear where you can:
- Enter the name of the report.
- Enter the e-mail addresses of the recipients, separated by commas.
- Customize the message in the e-mail.
- Choose the file type (CSV/PDF).
- Choose the Date Range included in the report from:
- Today
- Yesterday
- Last 7 days
- This week
- Last week
- The last 2 weeks
- This month
- Last month
- Select the delivery Frequency – how often the report is sent. Choose from:
- Daily
- Weekly
- Bi-weekly
- Monthly
- Choose the delivery time – the exact time when the report is sent.
- Select the days the report will be sent.

You can then choose to Send Preview or Schedule & Save – stores your scheduled report, which you can view via the All Reports > Customized reports section.
Exporting Reports
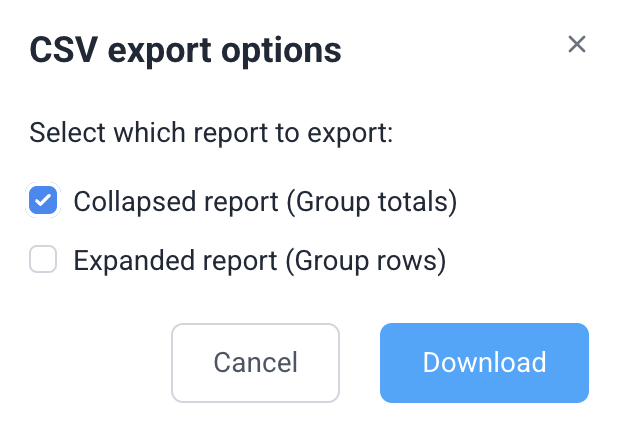
Reports can be exported as a PDF or CSV file by clicking the Export button. When downloading the report in a collapsed format via PDF, the report will be exported with sum totals.
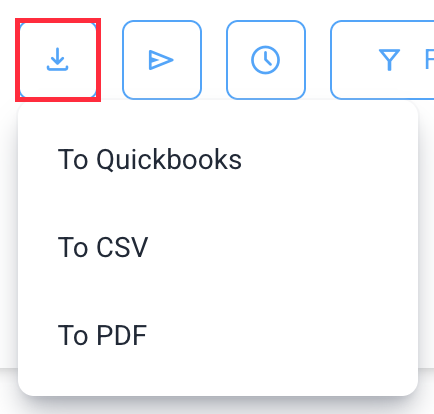
- Collapsed report – shows the group totals at the bottom of the report
- Expanded report – shows all data rows without totals
Saving Reports
You can save reports to save the current state of the report for future use. To do this, click on the Save button. You have the option to:
- Save changes – saves the current state of the report, including applied filters, columns, sort, and group by settings.
- Save as copy – saves the current report as a new version of an existing report.
- Delete – deletes a saved report.

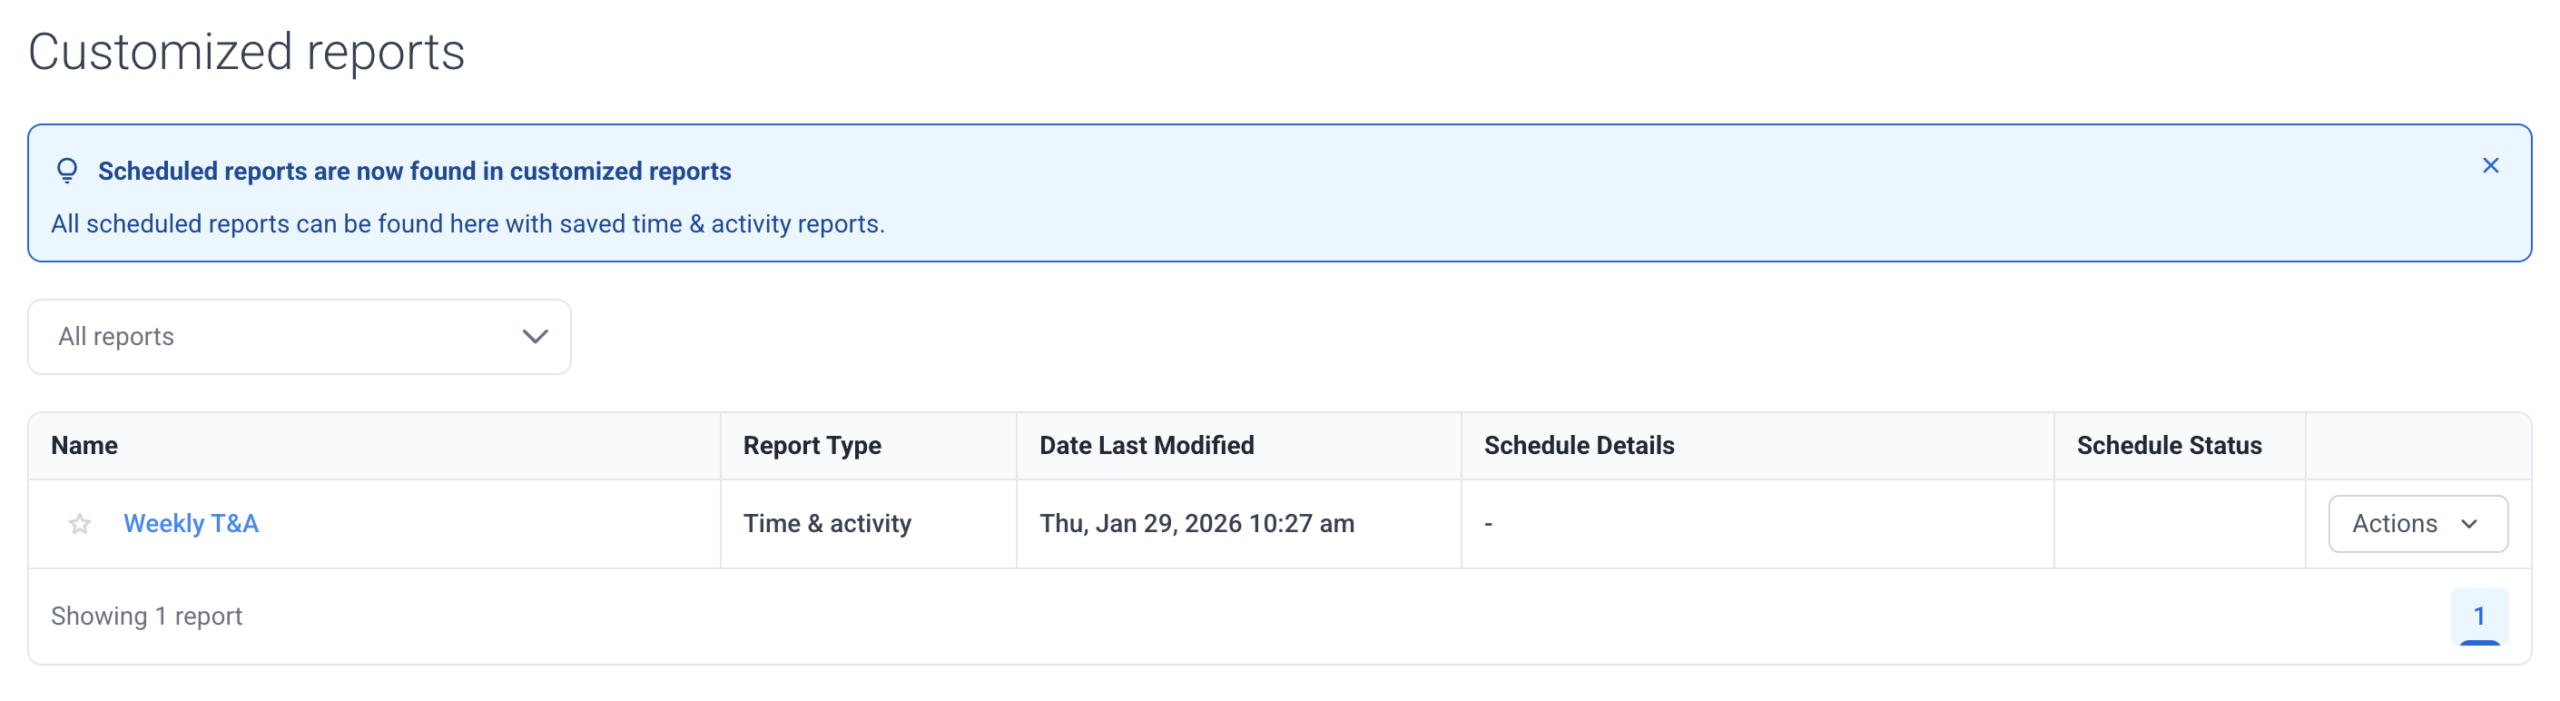
You can access saved custom reports via the Customized reports section:
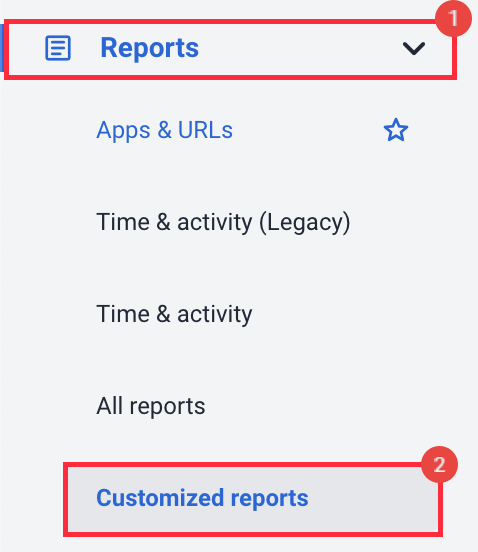
On this page, you will see the reports you’ve saved and/or scheduled. Note that saved reports are pre-selected when reopening the report.
Here’s a sample custom time and activity report as well: